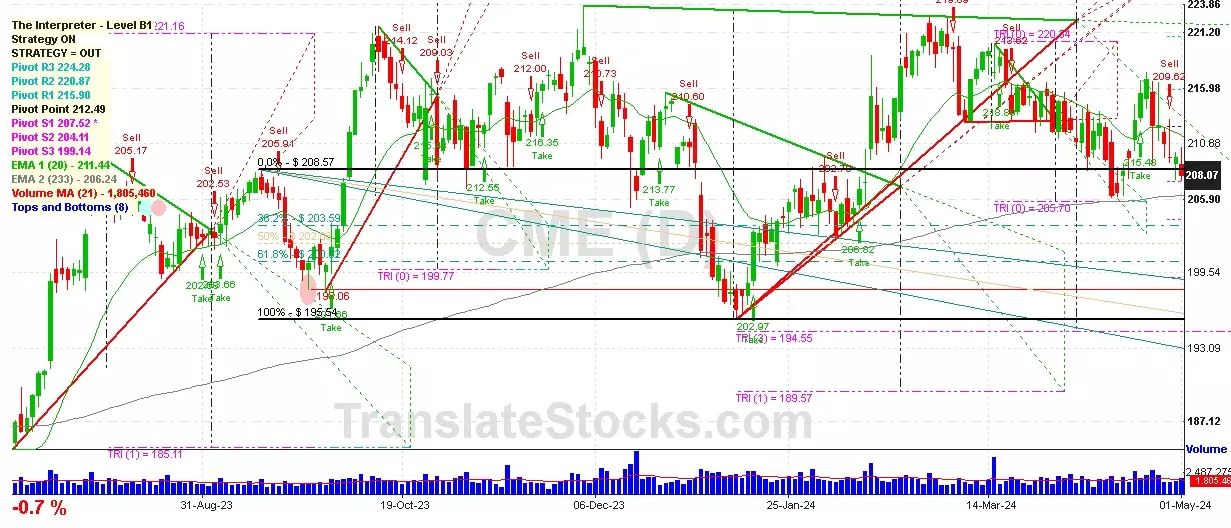
Hey Friend, I'm analysing CME GROUP INC (CME), and it is between the Support of $ 207.52 (PivotS1) and the Resistance of $ 208.57 (0% of Fibonacci). The stock is also approaching the line of PivotS1 at $ 207.52, and if it goes below this line it could reach the next Support of Triangle projection at $205.70.

| Date | Price $ | Result % | Candle Name | Side |
|---|---|---|---|---|
| 001 18 Mar 2024 | Buy Price: 218.89 | Profit: Open Day1 ($ 219.59) | Abandoned Baby | Buy |
| 002 29 Feb 2024 | Sell Price: 220.35 | Profit: Open Day1 ($ 220.25) | Dark Cloud Cover | Sell |
| 003 18 Dec 2023 | Buy Price: 211.19 | Profit: Open Day1 ($ 211.65) | Abandoned Baby | Buy |
| 004 27 Oct 2023 | Sell Price: 209.03 | Loss: Close Day2 ($ 213.46) | Abandoned Baby | Sell |
| 005 05 Sep 2023 | Sell Price: 202.53 | Loss: Close Day2 ($ 205.29) | Engulfing | Sell |
| 006 10 Aug 2023 | Sell Price: 204.80 | Profit: Open Day1 ($ 204.59) | Engulfing | Sell |
| 007One Year Average | Both Sides Result for 6 Signals |
Loss: $ -5.72 ($ -0.95 / Signal) |
All of Them | Buy + Sell |
| Simple Moving Averages (SMA) Period | Value $ | Signal | Exponential Moving Averages (EMA) Period | Value $ | Signal | |
|---|---|---|---|---|---|---|
| 2 | 208.86 | SELL | 2 | 208.66 | SELL | |
| 3 | 209.11 | SELL | 3 | 209.15 | SELL | |
| 5 | 210.16 | SELL | 5 | 209.91 | SELL | |
| 8 | 211.96 | SELL | 8 | 210.50 | SELL | |
| 13 | 210.73 | SELL | 13 | 210.96 | SELL | |
| 21 | 211.03 | SELL | 21 | 211.51 | SELL | |
| 34 | 212.76 | SELL | 34 | 212.02 | SELL | |
| 55 | 214.22 | SELL | 55 | 212.09 | SELL | |
| 90 | 210.52 | SELL | 90 | 211.40 | SELL | |
| 200 | 209.01 | SELL | 200 | 207.28 | BUY |
Cme Group Inc
IPO: 2002-12-06
Ticker: CMEIndices: S&P 500,
Exchange: Nasdaq Nms - Global Market (US - USD)
Website: https://www.cmegroup.com/
Phone:
Common Stock
Finance (
Security & Commodity Brokers, Dealers, Exchanges & Services
 Click to Enlarge