| Date | Price $ | Result % | Candle Name | Side |
|---|---|---|---|---|
| 001 05 Apr 2024 | Sell Price: 56.75 | Profit: Close Day1 ($ 56.69) | Engulfing | Sell |
| 002 11 Dec 2023 | Buy Price: 37.97 | Profit: Close Day2 ($ 39.65) | Abandoned Baby | Buy |
| 003 11 Dec 2023 | Buy Price: 37.93 | Profit: Close Day2 ($ 39.65) | Engulfing | Buy |
| 004 14 Nov 2023 | Buy Price: 35.53 | Profit: Open Day1 ($ 36.11) | Abandoned Baby | Buy |
| 005 11 Sep 2023 | Buy Price: 49.02 | Loss: Close Day2 ($ 48.84) | Engulfing | Buy |
| 006 15 Aug 2023 | Buy Price: 45.43 | Loss: Close Day2 ($ 44.20) | Piercing Line | Buy |
| 007 31 May 2023 | Buy Price: 37.23 | Profit: Open Day2 ($ 37.82) | Engulfing | Buy |
| 008One Year Average | Both Sides Result for 7 Signals |
Profit: $ 3.22 ($ 0.46 / Signal) |
All of Them | Buy + Sell |
| Simple Moving Averages (SMA) Period | Value $ | Signal | Exponential Moving Averages (EMA) Period | Value $ | Signal | |
|---|---|---|---|---|---|---|
| 2 | 56.42 | BUY | 2 | 56.41 | BUY | |
| 3 | 56.28 | BUY | 3 | 56.33 | BUY | |
| 5 | 56.20 | BUY | 5 | 56.23 | BUY | |
| 8 | 56.08 | BUY | 8 | 56.17 | BUY | |
| 13 | 56.00 | BUY | 13 | 56.14 | BUY | |
| 21 | 56.22 | BUY | 21 | 56.17 | BUY | |
| 34 | 56.24 | BUY | 34 | 56.09 | BUY | |
| 55 | 56.66 | SELL | 55 | 55.39 | BUY | |
| 90 | 54.35 | BUY | 90 | 53.73 | BUY | |
| 200 | 48.28 | BUY | 200 | 51.85 | BUY |
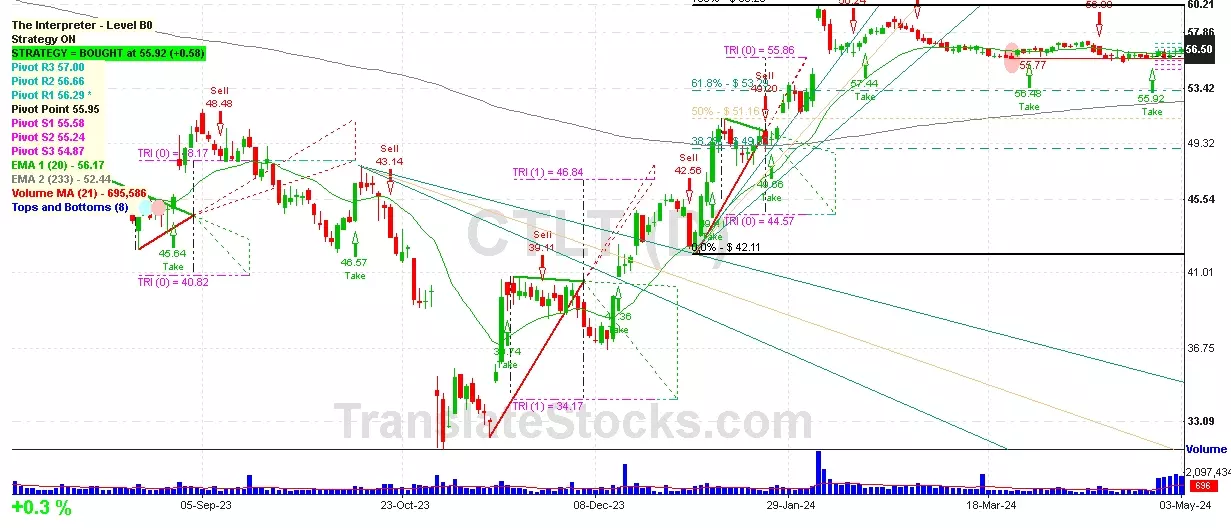
Catalent Inc
IPO: 2014-07-31
Ticker: CTLTIndices: S&P 500,
Exchange: New York Stock Exchange, Inc. (US - USD)
Website: https://www.catalent.com/
Phone:
Common Stock
Life Sciences (
Pharmaceutical Preparations

 Click to Enlarge