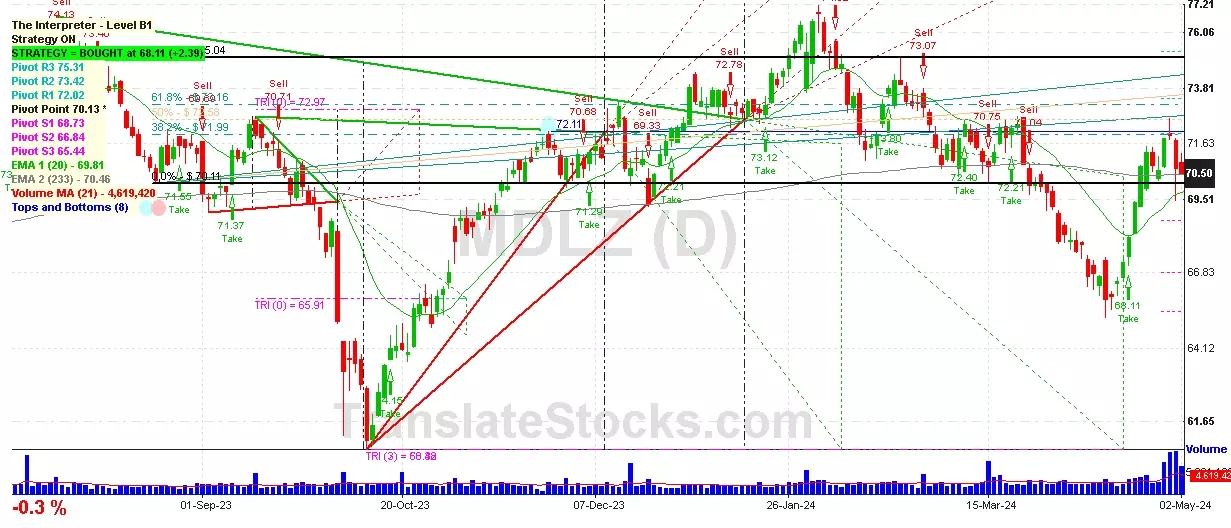
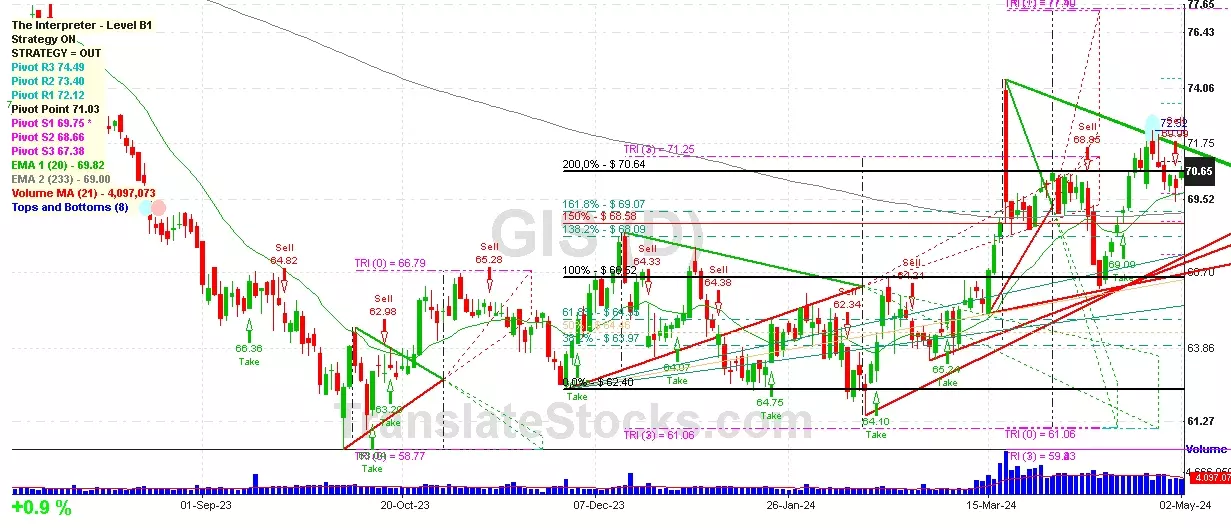
Hey Friend, I'm analysing GENERAL MILLS INC (GIS), and it is between the Support of $ 70.64 (200% of Fibonacci) and the Resistance of $ 71.03 (Pivot). The stock is also approaching the line of Pivot at $ 71.03, and if it goes above this line it could reach the next Resistance of Triangle projection at $71.25.

| Date | Price $ | Result % | Candle Name | Side |
|---|---|---|---|---|
| 001 19 Oct 2023 | Sell Price: 62.86 | Loss: Close Day2 ($ 63.23) | Abandoned Baby | Sell |
| 002 02 Aug 2023 | Buy Price: 75.45 | Loss: Close Day2 ($ 73.59) | Engulfing | Buy |
| 003 25 Jul 2023 | Sell Price: 76.91 | Profit: Open Day1 ($ 76.79) | Engulfing | Sell |
| 004 20 Jun 2023 | Sell Price: 80.68 | Loss: Close Day2 ($ 81.30) | Engulfing | Sell |
| 005 20 Jun 2023 | Sell Price: 80.64 | Loss: Close Day2 ($ 81.30) | Dark Cloud Cover | Sell |
| 006 09 May 2023 | Sell Price: 89.66 | Profit: Open Day1 ($ 89.55) | Engulfing | Sell |
| 007 09 May 2023 | Sell Price: 89.59 | Profit: Open Day1 ($ 89.55) | Dark Cloud Cover | Sell |
| 008One Year Average | Both Sides Result for 7 Signals |
Loss: $ -3.24 ($ -0.46 / Signal) |
All of Them | Buy + Sell |
| Simple Moving Averages (SMA) Period | Value $ | Signal | Exponential Moving Averages (EMA) Period | Value $ | Signal | |
|---|---|---|---|---|---|---|
| 2 | 70.32 | BUY | 2 | 70.48 | BUY | |
| 3 | 70.37 | BUY | 3 | 70.46 | BUY | |
| 5 | 70.43 | BUY | 5 | 70.47 | BUY | |
| 8 | 70.75 | SELL | 8 | 70.41 | BUY | |
| 13 | 70.23 | BUY | 13 | 70.18 | BUY | |
| 21 | 69.65 | BUY | 21 | 69.77 | BUY | |
| 34 | 69.41 | BUY | 34 | 69.08 | BUY | |
| 55 | 67.63 | BUY | 55 | 68.20 | BUY | |
| 90 | 66.31 | BUY | 90 | 67.50 | BUY | |
| 200 | 66.67 | BUY | 200 | 68.55 | BUY |
General Mills Inc
IPO: 1928-11-30
Ticker: GISIndices: S&P 500,
Exchange: New York Stock Exchange, Inc. (US - USD)
Website: http://www.generalmills.com
Phone:
Common Stock
Manufacturing (
Grain Mill Products
 Click to Enlarge