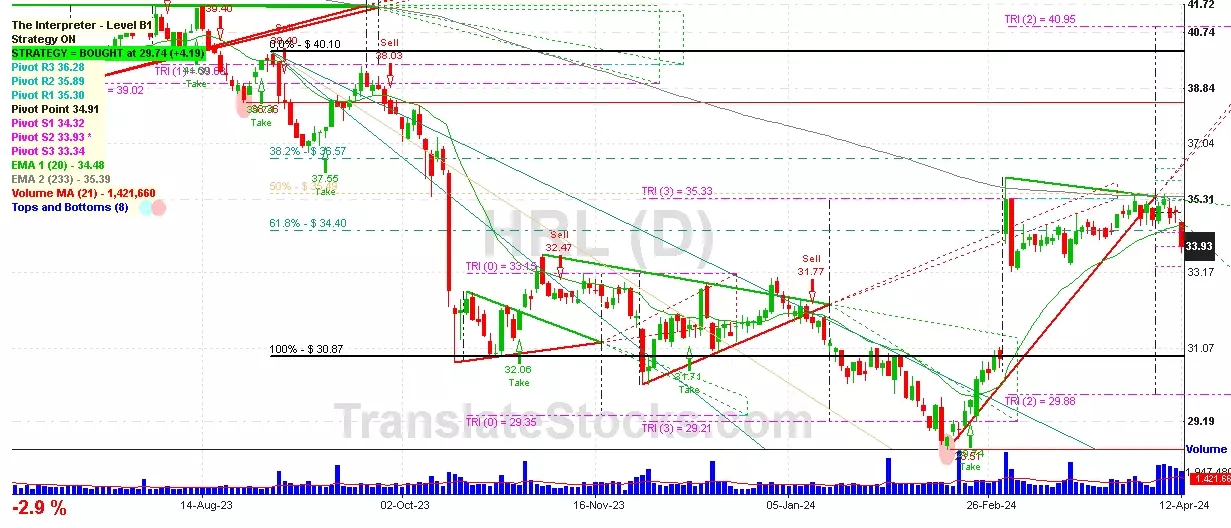
Hey Friend, I'm analysing HORMEL FOODS CORP (HRL), and it is between the Support of $ 33.93 (PivotS2) and the Resistance of $ 34.32 (PivotS1). The stock is also approaching the line of PivotS2 at $ 33.93, and if it goes below this line it could reach the next Support of Triangle projection at $33.15. Since it is nailed exactly on the line of $ 33.93, we should wait for another day to better understand which side the stock will move to.

| Date | Price $ | Result % | Candle Name | Side |
|---|---|---|---|---|
| 001 10 Apr 2024 | Sell Price: 34.77 | Profit: Open Day2 ($ 34.63) | Abandoned Baby | Sell |
| 002 08 Apr 2024 | Buy Price: 35.11 | Profit: Open Day1 ($ 35.17) | Engulfing | Buy |
| 003 13 Dec 2023 | Buy Price: 32.70 | Profit: Open Day1 ($ 32.78) | Engulfing | Buy |
| 004 06 Dec 2023 | Buy Price: 31.90 | Profit: Open Day1 ($ 32.00) | Engulfing | Buy |
| 005 31 Jul 2023 | Sell Price: 40.88 | Profit: Close Day1 ($ 40.59) | Engulfing | Sell |
| 006 13 Jun 2023 | Sell Price: 40.83 | Loss: Close Day2 ($ 41.30) | Abandoned Baby | Sell |
| 007 13 Jun 2023 | Buy Price: 40.84 | Profit: Open Day1 ($ 41.06) | Piercing Line | Buy |
| 008 31 May 2023 | Sell Price: 38.25 | Loss: Close Day2 ($ 40.77) | Dark Cloud Cover | Sell |
| 009 11 May 2023 | Buy Price: 40.29 | Profit: Open Day2 ($ 40.31) | Abandoned Baby | Buy |
| 010One Year Average | Both Sides Result for 9 Signals |
Loss: $ -2.08 ($ -0.23 / Signal) |
All of Them | Buy + Sell |
| Simple Moving Averages (SMA) Period | Value $ | Signal | Exponential Moving Averages (EMA) Period | Value $ | Signal | |
|---|---|---|---|---|---|---|
| 2 | 35.30 | BUY | 2 | 35.32 | SELL | |
| 3 | 35.40 | SELL | 3 | 35.30 | BUY | |
| 5 | 35.29 | BUY | 5 | 35.20 | BUY | |
| 8 | 34.95 | BUY | 8 | 35.06 | BUY | |
| 13 | 34.69 | BUY | 13 | 34.91 | BUY | |
| 21 | 34.82 | BUY | 21 | 34.71 | BUY | |
| 34 | 34.62 | BUY | 34 | 34.33 | BUY | |
| 55 | 33.31 | BUY | 55 | 33.81 | BUY | |
| 90 | 32.52 | BUY | 90 | 33.53 | BUY | |
| 200 | 34.52 | BUY | 200 | 34.82 | BUY |
Hormel Foods Corp
IPO: 1990-01-16
Ticker: HRLIndices: S&P 500,
Exchange: New York Stock Exchange, Inc. (US - USD)
Website: https://www.hormelfoods.com/
Phone:
Common Stock
Manufacturing (
Meat Packing Plants
 Click to Enlarge