| Date | Price $ | Result % | Candle Name | Side |
|---|---|---|---|---|
| 001 21 Feb 2024 | Sell Price: 192.55 | Profit: Open Day1 ($ 191.56) | Engulfing | Sell |
| 002 21 Feb 2024 | Sell Price: 192.49 | Profit: Open Day1 ($ 191.56) | Dark Cloud Cover | Sell |
| 003 15 Nov 2023 | Sell Price: 195.59 | Profit: Open Day1 ($ 194.89) | Engulfing | Sell |
| 004 15 Nov 2023 | Sell Price: 195.72 | Profit: Open Day1 ($ 194.89) | Dark Cloud Cover | Sell |
| 005 08 Nov 2023 | Buy Price: 189.02 | Profit: Open Day1 ($ 189.76) | Abandoned Baby | Buy |
| 006 03 Nov 2023 | Sell Price: 188.10 | Profit: Close Day1 ($ 187.66) | Engulfing | Sell |
| 007 03 Nov 2023 | Sell Price: 187.99 | Profit: Close Day1 ($ 187.66) | Dark Cloud Cover | Sell |
| 008 20 Oct 2023 | Sell Price: 190.94 | Profit: Open Day1 ($ 190.76) | Engulfing | Sell |
| 009 19 Sep 2023 | Sell Price: 209.07 | Profit: Close Day2 ($ 208.15) | Abandoned Baby | Sell |
| 010 31 May 2023 | Buy Price: 259.70 | Profit: Open Day1 ($ 260.38) | Abandoned Baby | Buy |
| 011 09 May 2023 | Sell Price: 274.08 | Profit: Open Day1 ($ 273.49) | Dark Cloud Cover | Sell |
| 012One Year Average | Both Sides Result for 11 Signals |
Profit: $ 7.33 ($ 0.67 / Signal) |
All of Them | Buy + Sell |
| Simple Moving Averages (SMA) Period | Value $ | Signal | Exponential Moving Averages (EMA) Period | Value $ | Signal | |
|---|---|---|---|---|---|---|
| 2 | 186.66 | SELL | 2 | 186.55 | SELL | |
| 3 | 187.15 | SELL | 3 | 186.67 | SELL | |
| 5 | 186.97 | SELL | 5 | 186.62 | SELL | |
| 8 | 185.90 | BUY | 8 | 186.71 | SELL | |
| 13 | 186.18 | SELL | 13 | 187.45 | SELL | |
| 21 | 189.86 | SELL | 21 | 188.74 | SELL | |
| 34 | 192.31 | SELL | 34 | 190.03 | SELL | |
| 55 | 192.05 | SELL | 55 | 190.97 | SELL | |
| 90 | 191.17 | SELL | 90 | 192.58 | SELL | |
| 200 | 199.43 | SELL | 200 | 201.08 | SELL |
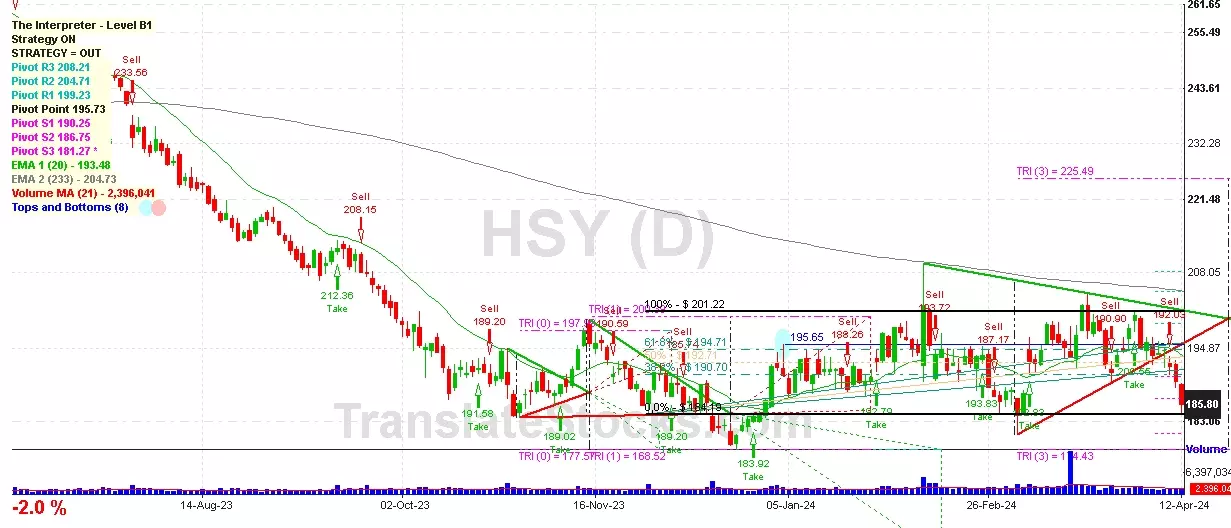
Hershey Co/the
IPO: 1927-12-01
Ticker: HSYIndices: S&P 500,
Exchange: New York Stock Exchange, Inc. (US - USD)
Website: https://www.thehersheycompany.com/
Phone:
Common Stock
Manufacturing (
Sugar & Confectionery Products

 Click to Enlarge