| Date | Price $ | Result % | Candle Name | Side |
|---|---|---|---|---|
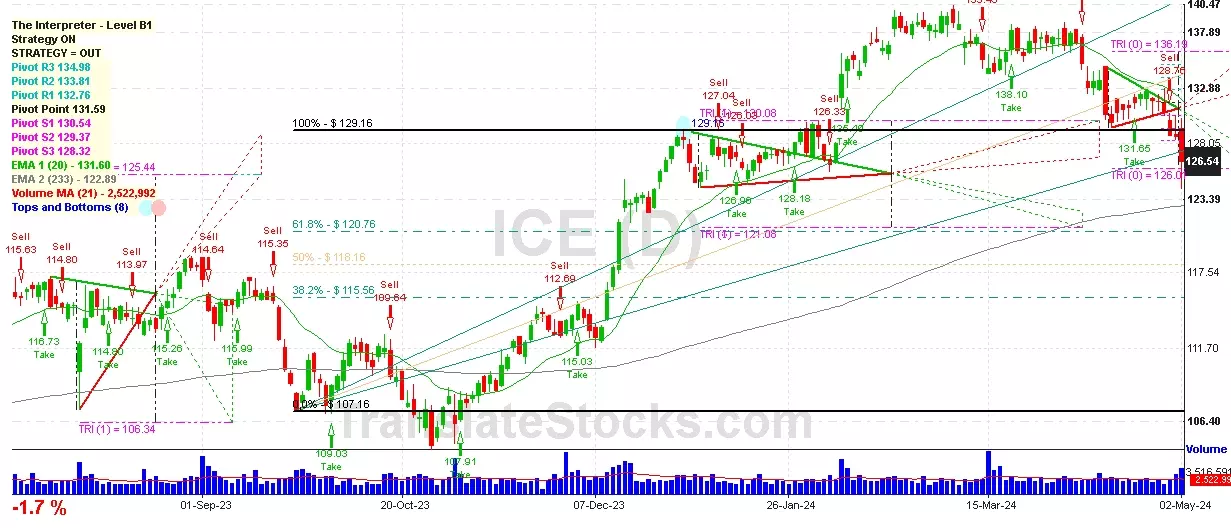
| 001 15 Apr 2024 | Sell Price: 130.54 | Profit: Close Day1 ($ 129.90) | Engulfing | Sell |
| 002 22 Mar 2024 | Sell Price: 136.23 | Profit: Open Day1 ($ 136.08) | Engulfing | Sell |
| 003 29 Feb 2024 | Sell Price: 138.42 | Profit: Open Day1 ($ 138.07) | Engulfing | Sell |
| 004 20 Feb 2024 | Sell Price: 136.43 | Profit: Open Day1 ($ 136.01) | Abandoned Baby | Sell |
| 005 08 Dec 2023 | Buy Price: 113.34 | Profit: Open Day1 ($ 113.92) | Engulfing | Buy |
| 006 27 Nov 2023 | Sell Price: 113.14 | Profit: Open Day1 ($ 112.96) | Abandoned Baby | Sell |
| 007 09 Nov 2023 | Sell Price: 108.55 | Loss: Close Day2 ($ 108.66) | Dark Cloud Cover | Sell |
| 008 18 Sep 2023 | Buy Price: 115.89 | Profit: Open Day1 ($ 116.08) | Piercing Line | Buy |
| 009 15 Sep 2023 | Sell Price: 115.72 | Profit: Open Day1 ($ 115.45) | Abandoned Baby | Sell |
| 010 14 Aug 2023 | Buy Price: 114.92 | Loss: Close Day2 ($ 113.97) | Engulfing | Buy |
| 011 27 Jul 2023 | Sell Price: 114.93 | Profit: Close Day2 ($ 114.80) | Engulfing | Sell |
| 012 21 Jul 2023 | Buy Price: 116.22 | Profit: Open Day1 ($ 116.50) | Abandoned Baby | Buy |
| 013 08 May 2023 | Sell Price: 107.22 | Profit: Open Day1 ($ 106.81) | Engulfing | Sell |
| 014One Year Average | Both Sides Result for 13 Signals |
Profit: $ 2.54 ($ 0.20 / Signal) |
All of Them | Buy + Sell |
| Simple Moving Averages (SMA) Period | Value $ | Signal | Exponential Moving Averages (EMA) Period | Value $ | Signal | |
|---|---|---|---|---|---|---|
| 2 | 127.61 | SELL | 2 | 127.35 | SELL | |
| 3 | 127.99 | SELL | 3 | 127.95 | SELL | |
| 5 | 129.29 | SELL | 5 | 128.82 | SELL | |
| 8 | 130.40 | SELL | 8 | 129.64 | SELL | |
| 13 | 130.59 | SELL | 13 | 130.60 | SELL | |
| 21 | 132.13 | SELL | 21 | 131.71 | SELL | |
| 34 | 133.79 | SELL | 34 | 132.65 | SELL | |
| 55 | 135.35 | SELL | 55 | 132.54 | SELL | |
| 90 | 132.50 | SELL | 90 | 130.58 | SELL | |
| 200 | 121.94 | BUY | 200 | 124.16 | BUY |
Intercontinental Exchange In
IPO: 2005-11-16
Ticker: ICEIndices: S&P 500,
Exchange: New York Stock Exchange, Inc. (US - USD)
Website: https://www.intercontinentalexchange.com/
Phone:
Common Stock
Finance (
Security & Commodity Brokers, Dealers, Exchanges & Services

 Click to Enlarge