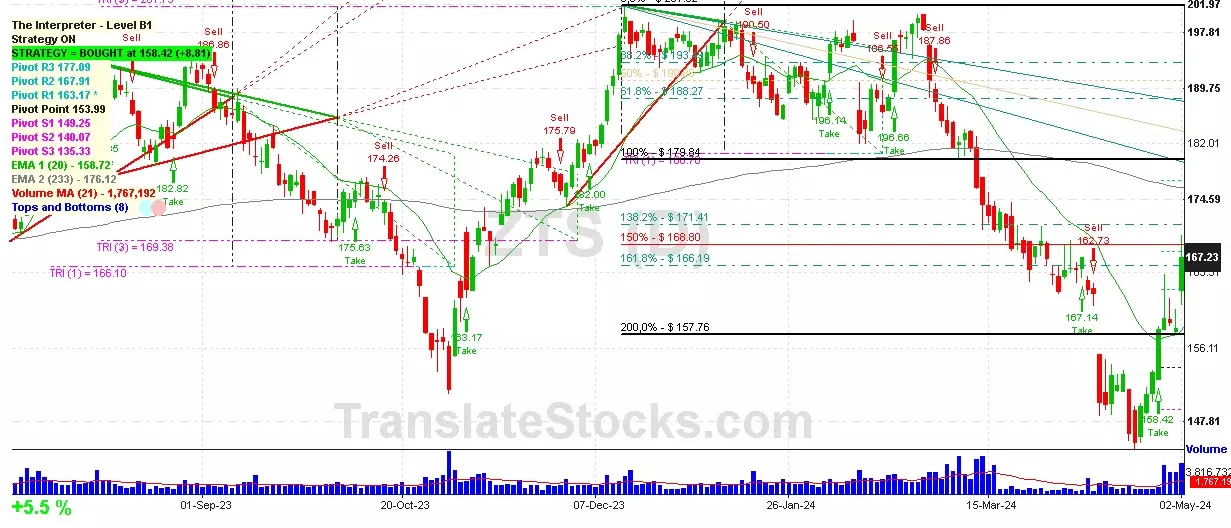
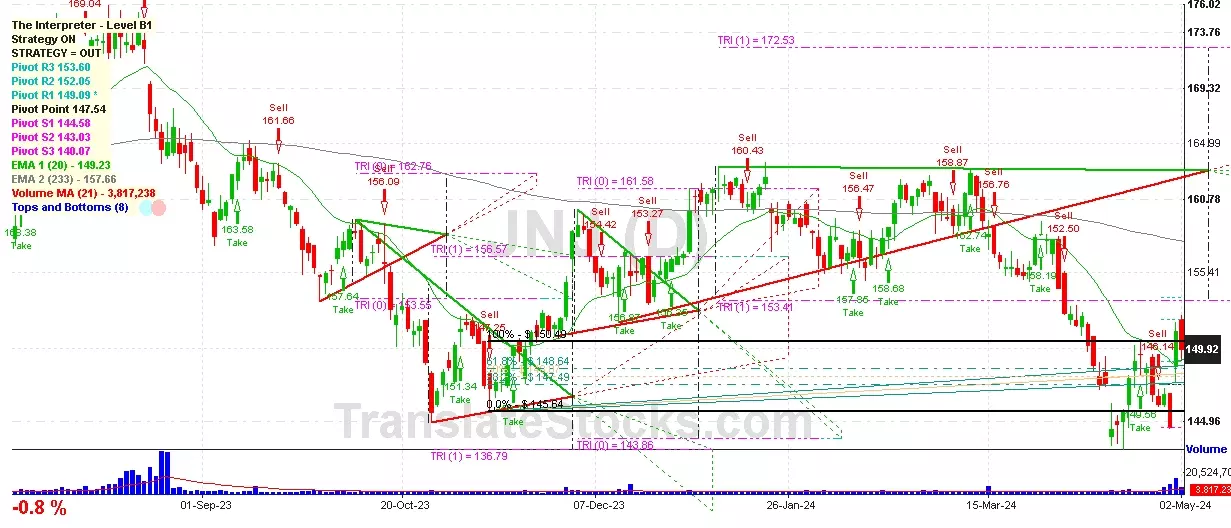
Hey Friend, I'm analysing JOHNSON & JOHNSON (JNJ), and it is between the Support of $ 149.09 (PivotR1) and the Resistance of $ 150.49 (100% of Fibonacci). The stock is also approaching the line of PivotR1 at $ 149.09, and if it goes below this line it could reach the next Support of 61.8% of Fibonacci at $ 148.64.

| Date | Price $ | Result % | Candle Name | Side |
|---|---|---|---|---|
| 001 30 Apr 2024 | Sell Price: 144.59 | Loss: Close Day2 ($ 149.92) | Engulfing | Sell |
| 002 01 Apr 2024 | Sell Price: 157.78 | Profit: Open Day1 ($ 156.57) | Abandoned Baby | Sell |
| 003 26 Oct 2023 | Sell Price: 149.00 | Profit: Open Day1 ($ 148.49) | Engulfing | Sell |
| 004 25 Oct 2023 | Buy Price: 151.57 | Profit: Open Day1 ($ 151.97) | Abandoned Baby | Buy |
| 005 20 Oct 2023 | Buy Price: 153.00 | Loss: Close Day2 ($ 151.23) | Abandoned Baby | Buy |
| 006 14 Sep 2023 | Sell Price: 163.74 | Profit: Close Day1 ($ 161.45) | Engulfing | Sell |
| 007 24 Aug 2023 | Buy Price: 165.09 | Profit: Close Day1 ($ 166.25) | Piercing Line | Buy |
| 008 22 Jun 2023 | Buy Price: 165.62 | Profit: Open Day1 ($ 166.11) | Abandoned Baby | Buy |
| 009 01 Jun 2023 | Sell Price: 154.54 | Loss: Close Day2 ($ 158.32) | Abandoned Baby | Sell |
| 010One Year Average | Both Sides Result for 9 Signals |
Loss: $ -4.82 ($ -0.54 / Signal) |
All of Them | Buy + Sell |
| Simple Moving Averages (SMA) Period | Value $ | Signal | Exponential Moving Averages (EMA) Period | Value $ | Signal | |
|---|---|---|---|---|---|---|
| 2 | 150.55 | SELL | 2 | 149.69 | BUY | |
| 3 | 148.56 | BUY | 3 | 149.19 | BUY | |
| 5 | 147.73 | BUY | 5 | 148.58 | BUY | |
| 8 | 147.95 | BUY | 8 | 148.25 | BUY | |
| 13 | 147.35 | BUY | 13 | 148.41 | BUY | |
| 21 | 148.50 | BUY | 21 | 149.37 | BUY | |
| 34 | 151.57 | SELL | 34 | 151.02 | SELL | |
| 55 | 154.74 | SELL | 55 | 152.83 | SELL | |
| 90 | 156.43 | SELL | 90 | 154.42 | SELL | |
| 200 | 157.97 | SELL | 200 | 157.05 | SELL |
Common Stock
Life Sciences (
Pharmaceutical Preparations
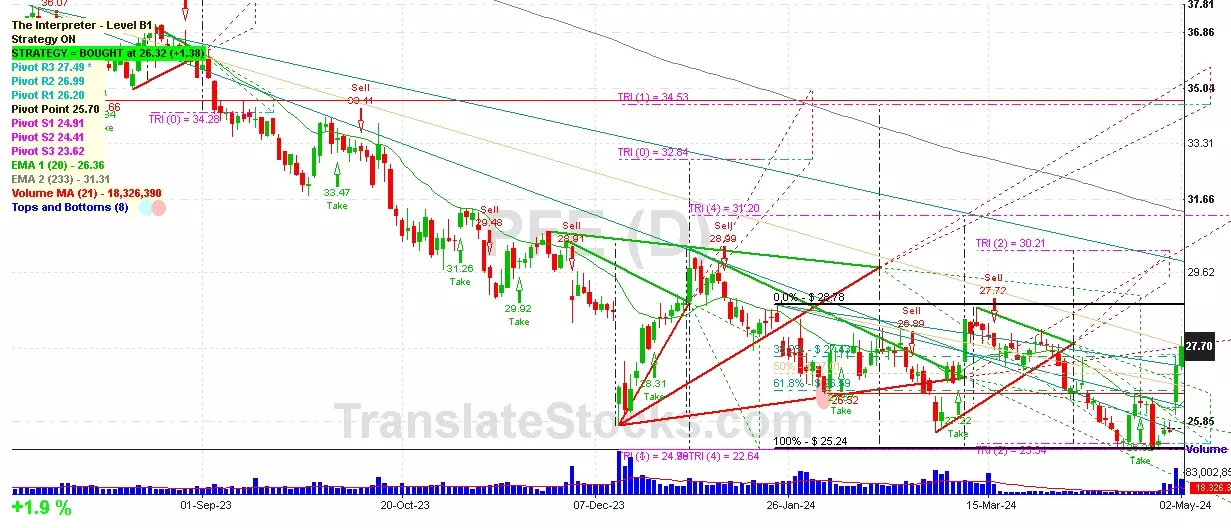
 Click to Enlarge
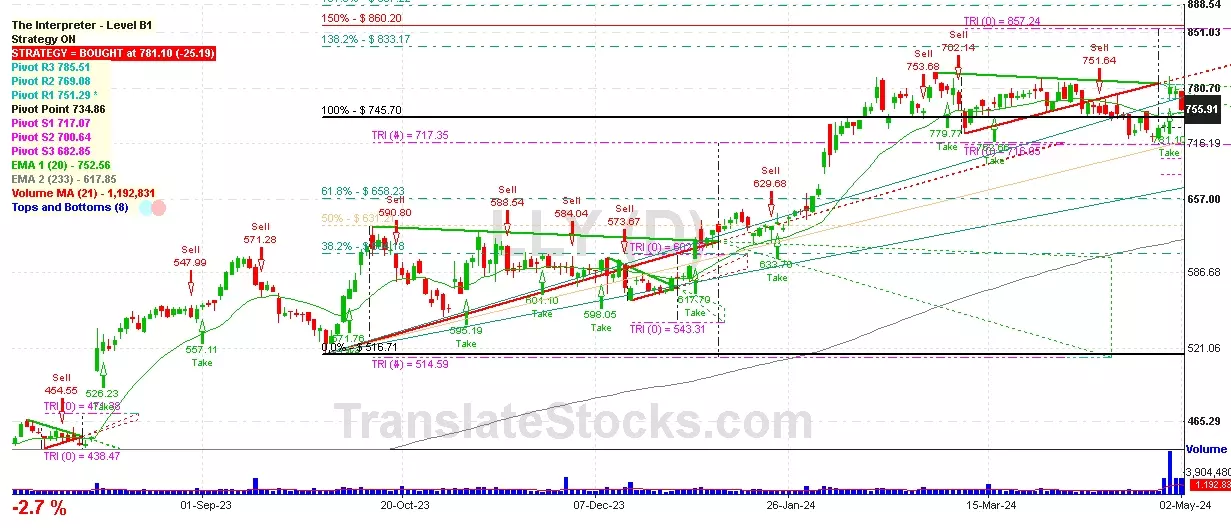