| Date | Price $ | Result % | Candle Name | Side |
|---|---|---|---|---|
| 001 07 Mar 2024 | Sell Price: 53.60 | Profit: Open Day1 ($ 53.53) | Engulfing | Sell |
| 002 24 Aug 2023 | Sell Price: 60.83 | Loss: Close Day2 ($ 61.37) | Dark Cloud Cover | Sell |
| 003One Year Average | Both Sides Result for 2 Signals |
Loss: $ -0.47 ($ -0.23 / Signal) |
All of Them | Buy + Sell |
| Simple Moving Averages (SMA) Period | Value $ | Signal | Exponential Moving Averages (EMA) Period | Value $ | Signal | |
|---|---|---|---|---|---|---|
| 2 | 59.13 | BUY | 2 | 59.96 | BUY | |
| 3 | 58.71 | BUY | 3 | 59.39 | BUY | |
| 5 | 58.41 | BUY | 5 | 58.86 | BUY | |
| 8 | 58.43 | BUY | 8 | 58.45 | BUY | |
| 13 | 57.76 | BUY | 13 | 58.01 | BUY | |
| 21 | 57.36 | BUY | 21 | 57.53 | BUY | |
| 34 | 56.81 | BUY | 34 | 56.99 | BUY | |
| 55 | 56.08 | BUY | 55 | 56.43 | BUY | |
| 90 | 55.69 | BUY | 90 | 56.09 | BUY | |
| 200 | 55.38 | BUY | 200 | 57.49 | BUY |
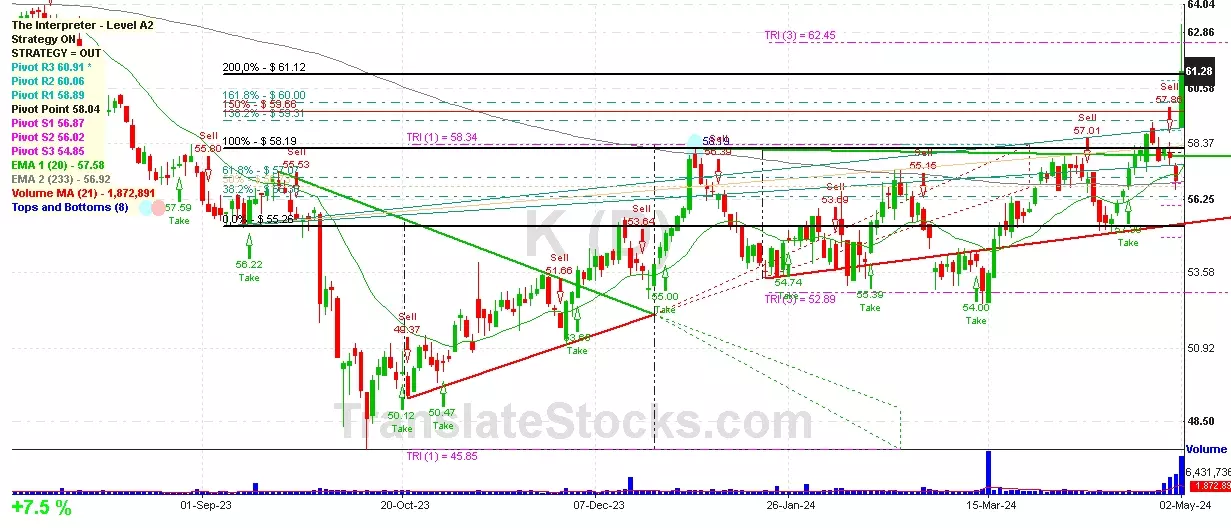
Kellogg Co
IPO: 1952-01-09
Ticker: KIndices: S&P 500,
Exchange: New York Stock Exchange, Inc. (US - USD)
Website: https://www.kelloggcompany.com/
Phone:
Common Stock
Manufacturing (
Grain Mill Products

 Click to Enlarge