| Date | Price $ | Result % | Candle Name | Side |
|---|---|---|---|---|
| 001 20 Feb 2024 | Sell Price: 755.66 | Profit: Open Day1 ($ 738.08) | Engulfing | Sell |
| 002 20 Dec 2023 | Sell Price: 570.21 | Loss: Close Day2 ($ 570.39) | Abandoned Baby | Sell |
| 003 25 Oct 2023 | Sell Price: 586.46 | Profit: Open Day1 ($ 580.00) | Dark Cloud Cover | Sell |
| 004 31 Jul 2023 | Sell Price: 454.14 | Profit: Close Day1 ($ 453.09) | Abandoned Baby | Sell |
| 005 31 Jul 2023 | Sell Price: 454.55 | Profit: Close Day1 ($ 453.09) | Engulfing | Sell |
| 006 13 Jun 2023 | Buy Price: 445.72 | Profit: Close Day1 ($ 447.72) | Piercing Line | Buy |
| 007 08 Jun 2023 | Buy Price: 445.66 | Profit: Open Day1 ($ 449.30) | Engulfing | Buy |
| 008One Year Average | Both Sides Result for 7 Signals |
Profit: $ 32.01 ($ 4.57 / Signal) |
All of Them | Buy + Sell |
| Simple Moving Averages (SMA) Period | Value $ | Signal | Exponential Moving Averages (EMA) Period | Value $ | Signal | |
|---|---|---|---|---|---|---|
| 2 | 772.23 | BUY | 2 | 771.54 | BUY | |
| 3 | 759.81 | BUY | 3 | 767.63 | BUY | |
| 5 | 762.42 | BUY | 5 | 763.11 | BUY | |
| 8 | 757.99 | BUY | 8 | 758.92 | BUY | |
| 13 | 748.02 | BUY | 13 | 755.73 | BUY | |
| 21 | 749.95 | BUY | 21 | 754.77 | BUY | |
| 34 | 758.73 | BUY | 34 | 753.05 | BUY | |
| 55 | 761.05 | BUY | 55 | 743.23 | BUY | |
| 90 | 721.72 | BUY | 90 | 718.50 | BUY | |
| 200 | 633.45 | BUY | 200 | 641.28 | BUY |
Eli Lilly & Co
IPO: 1970-07-09
Ticker: LLYIndices: S&P 500,
Exchange: New York Stock Exchange, Inc. (US - USD)
Website: https://www.lilly.com/
Phone:
Common Stock
Life Sciences (
Pharmaceutical Preparations

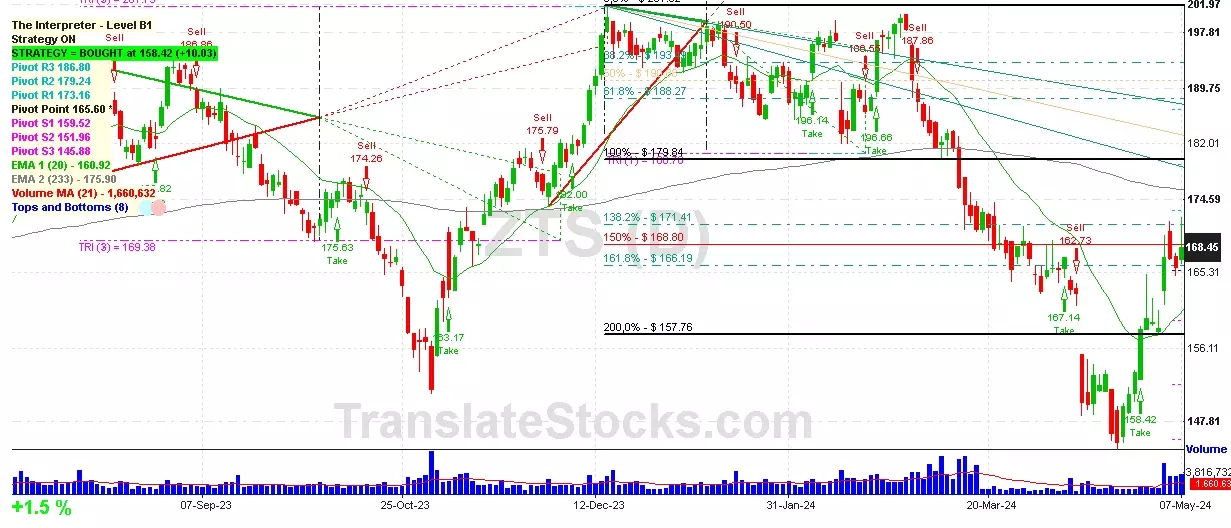
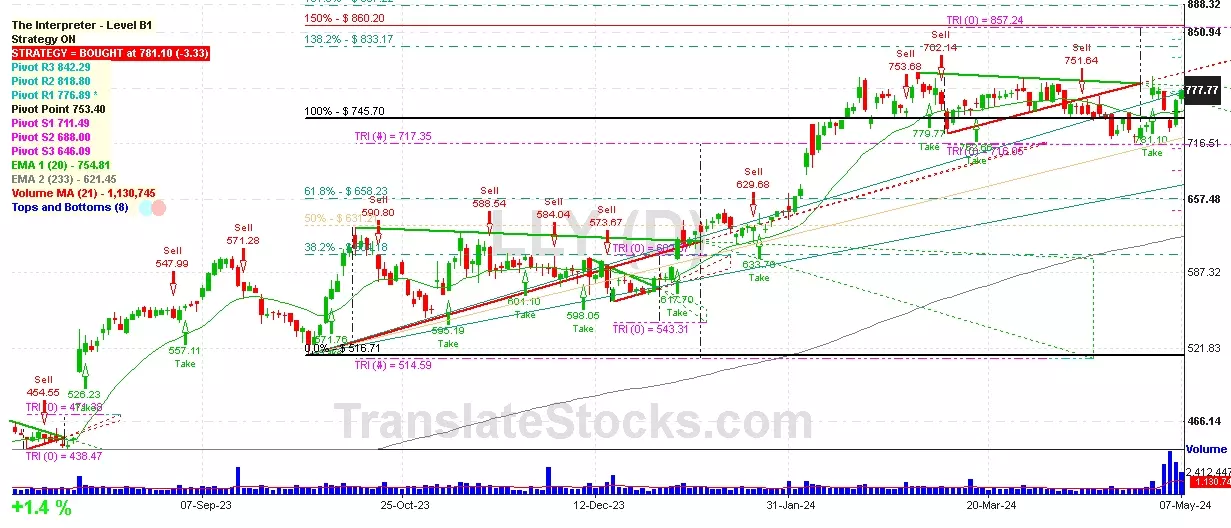 Click to Enlarge