| Date | Price $ | Result % | Candle Name | Side |
|---|---|---|---|---|
| 001 01 May 2024 | Buy Price: 372.89 | Profit: Close Day1 ($ 376.40) | Engulfing | Buy |
| 002 17 Apr 2024 | Buy Price: 375.41 | Profit: Open Day1 ($ 377.19) | Abandoned Baby | Buy |
| 003 14 Mar 2024 | Sell Price: 383.41 | Profit: Open Day1 ($ 378.72) | Abandoned Baby | Sell |
| 004 14 Mar 2024 | Sell Price: 383.33 | Profit: Open Day1 ($ 378.72) | Engulfing | Sell |
| 005 12 Mar 2024 | Buy Price: 388.93 | Profit: Open Day1 ($ 389.34) | Abandoned Baby | Buy |
| 006 12 Feb 2024 | Sell Price: 401.09 | Profit: Open Day1 ($ 378.43) | Dark Cloud Cover | Sell |
| 007 29 Nov 2023 | Buy Price: 361.89 | Profit: Close Day1 ($ 364.96) | Abandoned Baby | Buy |
| 008 13 Sep 2023 | Buy Price: 343.20 | Profit: Open Day1 ($ 346.28) | Abandoned Baby | Buy |
| 009 06 Sep 2023 | Buy Price: 340.68 | Profit: Close Day1 ($ 342.12) | Engulfing | Buy |
| 010 10 Aug 2023 | Buy Price: 339.29 | Loss: Close Day2 ($ 338.78) | Abandoned Baby | Buy |
| 011 10 Jul 2023 | Buy Price: 342.10 | Profit: Open Day2 ($ 344.26) | Abandoned Baby | Buy |
| 012 10 Jul 2023 | Buy Price: 341.99 | Profit: Open Day2 ($ 344.26) | Engulfing | Buy |
| 013One Year Average | Both Sides Result for 12 Signals |
Profit: $ 49.17 ($ 4.10 / Signal) |
All of Them | Buy + Sell |
| Simple Moving Averages (SMA) Period | Value $ | Signal | Exponential Moving Averages (EMA) Period | Value $ | Signal | |
|---|---|---|---|---|---|---|
| 2 | 378.48 | BUY | 2 | 378.75 | BUY | |
| 3 | 376.62 | BUY | 3 | 377.62 | BUY | |
| 5 | 374.96 | BUY | 5 | 376.68 | BUY | |
| 8 | 375.92 | BUY | 8 | 376.53 | BUY | |
| 13 | 376.42 | BUY | 13 | 377.33 | BUY | |
| 21 | 379.49 | BUY | 21 | 379.02 | BUY | |
| 34 | 383.64 | SELL | 34 | 380.88 | SELL | |
| 55 | 383.07 | SELL | 55 | 381.55 | SELL | |
| 90 | 384.65 | SELL | 90 | 378.76 | BUY | |
| 200 | 361.00 | BUY | 200 | 363.84 | BUY |
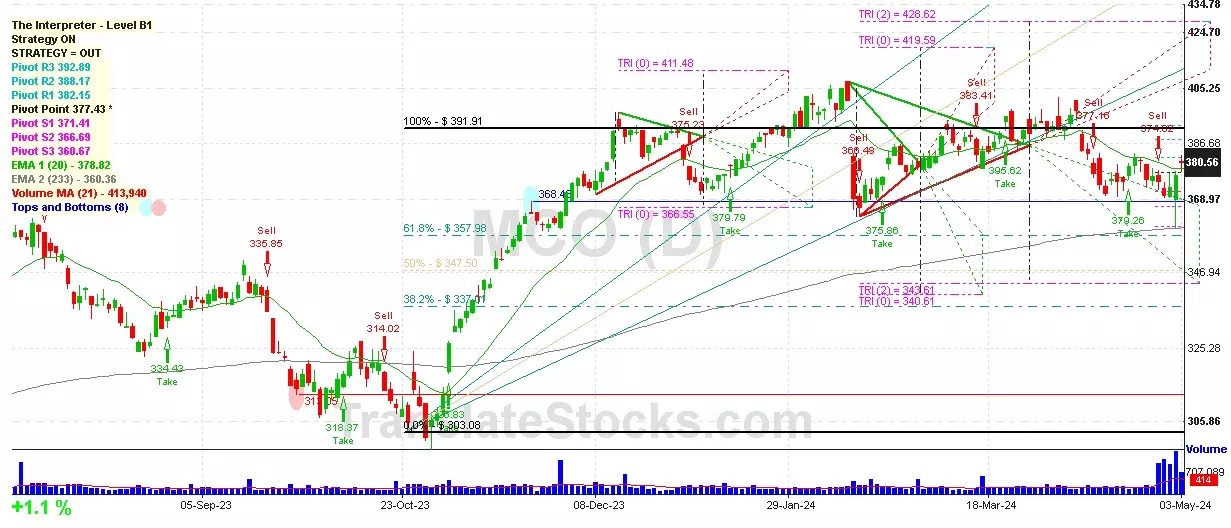
Moody's Corp
IPO: 1998-06-19
Ticker: MCOIndices: S&P 500,
Exchange: New York Stock Exchange, Inc. (US - USD)
Website: https://www.moodys.com/
Phone:
Common Stock
Trade & Services (
Services-consumer Credit Reporting, Collection Agencies

 Click to Enlarge