| Date | Price $ | Result % | Candle Name | Side |
|---|---|---|---|---|
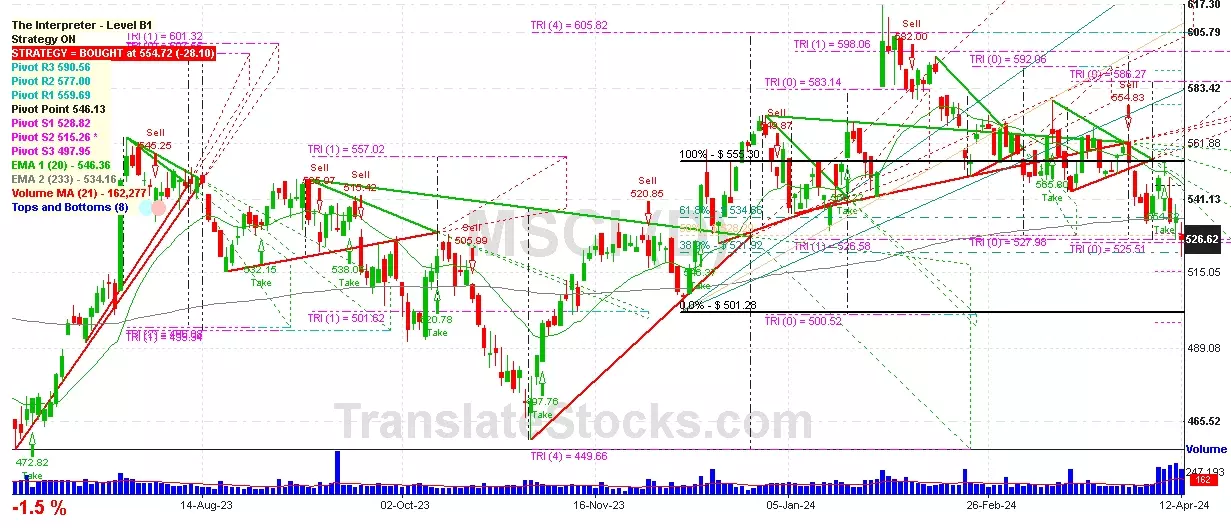
| 001 01 Apr 2024 | Sell Price: 554.83 | Profit: Open Day1 ($ 551.69) | Engulfing | Sell |
| 002 26 Mar 2024 | Buy Price: 551.68 | Profit: Open Day1 ($ 556.62) | Abandoned Baby | Buy |
| 003 28 Feb 2024 | Buy Price: 567.91 | Profit: Open Day1 ($ 569.79) | Engulfing | Buy |
| 004 10 Jan 2024 | Buy Price: 546.66 | Profit: Open Day1 ($ 549.78) | Abandoned Baby | Buy |
| 005 14 Dec 2023 | Sell Price: 542.11 | Profit: Open Day1 ($ 541.51) | Dark Cloud Cover | Sell |
| 006 01 Dec 2023 | Buy Price: 527.70 | Loss: Close Day2 ($ 523.43) | Engulfing | Buy |
| 007 30 Nov 2023 | Sell Price: 520.85 | Profit: Open Day1 ($ 519.13) | Abandoned Baby | Sell |
| 008 26 Oct 2023 | Buy Price: 481.55 | Profit: Open Day1 ($ 481.95) | Engulfing | Buy |
| 009 27 Sep 2023 | Sell Price: 511.98 | Loss: Close Day2 ($ 513.08) | Engulfing | Sell |
| 010 27 Sep 2023 | Sell Price: 511.94 | Loss: Close Day2 ($ 513.08) | Dark Cloud Cover | Sell |
| 011 20 Sep 2023 | Sell Price: 534.65 | Profit: Open Day1 ($ 527.34) | Engulfing | Sell |
| 012 20 Sep 2023 | Sell Price: 535.04 | Profit: Open Day1 ($ 527.34) | Dark Cloud Cover | Sell |
| 013 06 Sep 2023 | Buy Price: 541.84 | Profit: Close Day1 ($ 546.49) | Abandoned Baby | Buy |
| 014 17 Jul 2023 | Buy Price: 499.25 | Profit: Open Day1 ($ 500.00) | Piercing Line | Buy |
| 015 16 Jun 2023 | Sell Price: 477.73 | Profit: Open Day1 ($ 476.11) | Engulfing | Sell |
| 016 30 May 2023 | Sell Price: 471.41 | Profit: Open Day1 ($ 468.97) | Dark Cloud Cover | Sell |
| 017 17 May 2023 | Buy Price: 461.27 | Profit: Open Day1 ($ 461.70) | Abandoned Baby | Buy |
| 018 02 May 2023 | Sell Price: 468.49 | Profit: Open Day1 ($ 468.34) | Abandoned Baby | Sell |
| 019One Year Average | Both Sides Result for 18 Signals |
Profit: $ 34.33 ($ 1.91 / Signal) |
All of Them | Buy + Sell |
| Simple Moving Averages (SMA) Period | Value $ | Signal | Exponential Moving Averages (EMA) Period | Value $ | Signal | |
|---|---|---|---|---|---|---|
| 2 | 471.14 | BUY | 2 | 473.51 | BUY | |
| 3 | 468.97 | BUY | 3 | 473.01 | BUY | |
| 5 | 473.62 | BUY | 5 | 476.88 | BUY | |
| 8 | 486.97 | SELL | 8 | 484.99 | SELL | |
| 13 | 501.26 | SELL | 13 | 496.81 | SELL | |
| 21 | 518.75 | SELL | 21 | 510.17 | SELL | |
| 34 | 533.23 | SELL | 34 | 523.31 | SELL | |
| 55 | 545.77 | SELL | 55 | 533.41 | SELL | |
| 90 | 551.32 | SELL | 90 | 537.80 | SELL | |
| 200 | 534.49 | SELL | 200 | 532.04 | SELL |
Msci Inc
IPO: 2007-11-15
Ticker: MSCIIndices: S&P 500,
Exchange: New York Stock Exchange, Inc. (US - USD)
Website: https://www.msci.com/
Phone:
Common Stock
Trade & Services (
Services-business Services, Nec

 Click to Enlarge