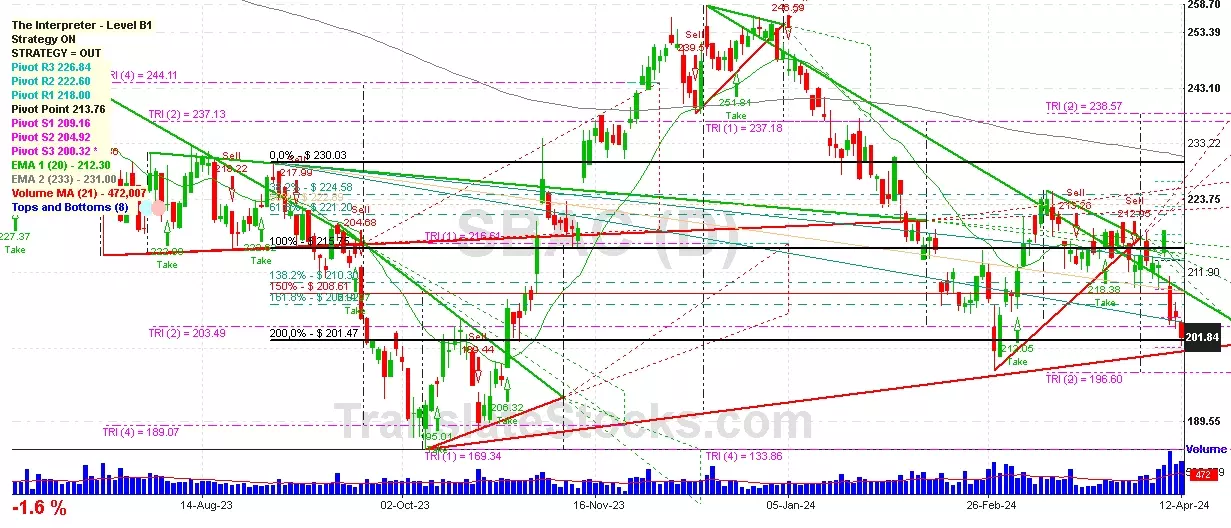
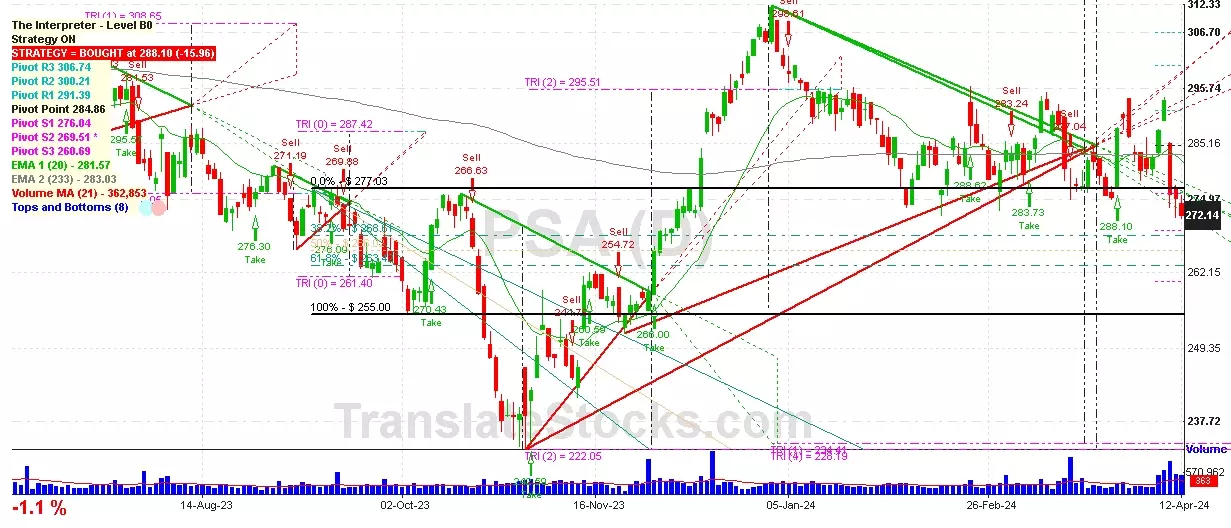
Hey Friend, I'm analysing PUBLIC STORAGE (PSA), and it is between the Support of $ 269.51 (PivotS2) and the Resistance of $ 276.04 (PivotS1). The stock is also approaching the line of PivotS2 at $ 269.51, and if it goes below this line it could reach the next Support of 38.2% of Fibonacci at $ 268.61.

| Date | Price $ | Result % | Candle Name | Side |
|---|---|---|---|---|
| 001 18 Mar 2024 | Buy Price: 277.58 | Profit: Close Day2 ($ 282.03) | Abandoned Baby | Buy |
| 002 01 Feb 2024 | Buy Price: 286.46 | Loss: Close Day2 ($ 274.16) | Engulfing | Buy |
| 003 08 Jan 2024 | Buy Price: 300.12 | Loss: Close Day2 ($ 295.22) | Engulfing | Buy |
| 004 02 Jan 2024 | Buy Price: 311.83 | Loss: Close Day2 ($ 300.18) | Engulfing | Buy |
| 005 13 Nov 2023 | Buy Price: 246.33 | Profit: Open Day1 ($ 252.70) | Piercing Line | Buy |
| 006 30 Oct 2023 | Buy Price: 238.82 | Profit: Open Day1 ($ 244.62) | Engulfing | Buy |
| 007 07 Sep 2023 | Buy Price: 273.14 | Profit: Open Day1 ($ 273.83) | Engulfing | Buy |
| 008 05 Jun 2023 | Sell Price: 283.15 | Profit: Close Day1 ($ 280.01) | Engulfing | Sell |
| 009 31 May 2023 | Sell Price: 283.30 | Loss: Close Day2 ($ 288.39) | Engulfing | Sell |
| 010One Year Average | Both Sides Result for 9 Signals |
Loss: $ -13.49 ($ -1.50 / Signal) |
All of Them | Buy + Sell |
| Simple Moving Averages (SMA) Period | Value $ | Signal | Exponential Moving Averages (EMA) Period | Value $ | Signal | |
|---|---|---|---|---|---|---|
| 2 | 258.21 | SELL | 2 | 258.42 | SELL | |
| 3 | 259.53 | SELL | 3 | 259.03 | SELL | |
| 5 | 260.45 | SELL | 5 | 260.03 | SELL | |
| 8 | 260.59 | SELL | 8 | 261.80 | SELL | |
| 13 | 264.30 | SELL | 13 | 264.93 | SELL | |
| 21 | 272.39 | SELL | 21 | 268.87 | SELL | |
| 34 | 276.07 | SELL | 34 | 272.88 | SELL | |
| 55 | 278.87 | SELL | 55 | 276.07 | SELL | |
| 90 | 284.53 | SELL | 90 | 277.70 | SELL | |
| 200 | 276.24 | SELL | 200 | 280.04 | SELL |
Public Storage
IPO: 1984-10-19
Ticker: PSAIndices: S&P 500,
Exchange: New York Stock Exchange, Inc. (US - USD)
Website: http://www.publicstorage.com
Phone:
REIT (Real Estate Investment Trust)
Real Estate & Construction (
Real Estate Investment Trusts
Year | 2020 | 2019 | 2018 | 2017 | 2016 | 2015 | 2014 | 2013 | 2012 | 2011 | 2010 | 2009 | 2008 | 2007 | 2006 | |
|---|---|---|---|---|---|---|---|---|---|---|---|---|---|---|---|---|
| 1 | Assets + | 11,817 | 11,365 | 10,928 | 10,733 | 10,130 | 9,778 | 9,819 | 9,876 | 8,793 | 8,933 | 9,495 | 9,806 | 9,936 | 245 | 536 |
| 2 | Real Estate Investment Property + | 4,376 | 4,187 | 4,048 | 3,947 | 3,781 | 3,565 | 3,477 | 3,321 | 2,869 | 2,812 | 2,789 | 2,717 | 2,716 | 0 | 0 |
| 3 | Real Estate Investment Property + | 4,376 | 4,187 | 4,048 | 3,947 | 3,781 | 3,565 | 3,477 | 3,321 | 2,869 | 2,812 | 2,789 | 2,717 | 2,716 | 0 | 0 |
| 4 | Investments in and Advance to Affiliates + | 773 | 768 | 784 | 724 | 689 | 809 | 814 | 856 | 735 | 715 | 602 | 0 | 0 | 0 | 0 |
| 5 | Cash and Cash Equivalents + | 258 | 410 | 361 | 433 | 184 | 104 | 188 | 19 | 17 | 139 | 456 | 764 | 681 | 245 | 536 |
| 6 | Property + | 0 | 0 | 0 | 0 | 0 | 9,640 | 9,386 | 8,965 | 8,201 | 7,962 | 7,798 | 7,576 | 7,491 | 0 | 0 |
| 7 | Property + | 0 | 0 | 0 | 0 | 0 | 9,640 | 9,386 | 8,965 | 8,201 | 7,962 | 7,798 | 7,576 | 7,491 | 0 | 0 |
| 8 | Intangible Assets + | 19 | 19 | 19 | 19 | 19 | 19 | 19 | 19 | 19 | -24 | 42 | 38 | 52 | 0 | 0 |
| 9 | Finite-Lived Intangible Assets + | 11 | 12 | 16 | 22 | -54 | -66 | -69 | -35 | -25 | -24 | -22 | -15 | 0 | 0 | 0 |
| 10 | Liabilities and Equity + | 11,817 | 11,365 | 10,928 | 10,733 | 10,130 | 9,778 | 9,819 | 9,876 | 8,793 | 8,933 | 9,495 | 9,806 | 9,936 | 9,263 | 8,707 |
| 11 | Liabilities + | 3,240 | 2,286 | 1,784 | 1,769 | 689 | 581 | 312 | 1,057 | 671 | 609 | 774 | 731 | 856 | 0 | 0 |
| 12 | Debt and Lease Obligation + | 0 | 0 | 0 | 0 | 0 | 0 | 0 | 700 | 0 | 0 | 0 | 0 | 0 | 0 | 0 |
| 13 | Temporary Equity + | 0 | 0 | 0 | 0 | 0 | 0 | 25 | 25 | 25 | 37 | 12 | 0 | 0 | 0 | 0 |
| 14 | Redeemable Noncontrolling Interest + | 0 | 0 | 0 | 0 | 0 | 0 | 0 | 0 | 0 | 12 | 12 | 0 | 0 | 0 | 0 |
| 15 | Temporary Equity + | 0 | 0 | 0 | 0 | 0 | 0 | 25 | 25 | 25 | 25 | 0 | 0 | 0 | 0 | 0 |
| 16 | Stockholders' Equity + | 8,577 | 9,080 | 9,145 | 8,964 | 9,442 | 9,198 | 9,507 | 8,819 | 8,123 | 8,311 | 8,709 | 9,061 | 9,067 | 9,263 | 8,707 |
| 17 | Stockholders' Equity Attributable to Parent + | 8,559 | 9,063 | 9,119 | 8,940 | 9,412 | 9,171 | 9,481 | 8,792 | 8,094 | 8,288 | 8,677 | 8,928 | 8,709 | 0 | 0 |
| 18 | Stockholders' Equity + | 3,792.11 | 4,065.11 | 4,025.11 | 0.11 | 0.11 | 0.11 | 0.11 | 0.11 | 0.11 | 0.10 | 0.10 | 0.10 | 0 | 0 | 0 |
| 19 | Preferred Stock + | 3,792.01 | 4,065.01 | 4,025.01 | 0.01 | 0.01 | 0.01 | 0.01 | 0.01 | 0.01 | 0 | 0 | 0 | 0 | 0 | 0 |
| 20 | Common Stock + | 0.10 | 0.10 | 0.10 | 0.10 | 0.10 | 0.10 | 0.10 | 0.10 | 0.10 | 0.10 | 0.10 | 0.10 | 0 | 0 | 0 |
| 21 | Partners' Capital + | -915 | -666 | -577 | -676 | -488 | -435 | -375 | -318 | -279 | -260 | -236 | -154 | -290 | 0 | 0 |
| 22 | Partners' Capital + | -915 | -666 | -577 | -676 | -488 | -435 | -375 | -318 | -279 | -260 | -236 | -154 | -290 | 0 | 0 |
| 23 | Limited Liability Company (LLC) Members' Equity + | -958 | -731 | -641 | -751 | -583 | -504 | -423 | -318 | -280 | -283 | -252 | -169 | -322 | 0 | 0 |
| 24 | Limited Liability Company (LLC) Members' Equity + | -958 | -731 | -641 | -751 | -583 | -504 | -423 | -318 | -280 | -283 | -252 | -169 | -322 | 0 | 0 |
| 25 | Long-Term Assets + | 175 | 214 | 175 | 175 | 175 | 175 | 175 | 175 | 175 | 175 | 175 | 175 | 175 | 0 | 0 |
| 26 | Operating Lease + | 0 | 39 | 0 | 0 | 0 | 0 | 0 | 0 | 0 | 0 | 0 | 0 | 0 | 0 | 0 |
| 27 | Goodwill + | 175 | 175 | 175 | 175 | 175 | 175 | 175 | 175 | 175 | 175 | 175 | 175 | 175 | 0 | 0 |
| 28 | Total Assets + | 11,817 | 11,365 | 10,928 | 10,733 | 10,130 | 9,778 | 9,819 | 9,876 | 8,793 | 8,933 | 9,495 | 9,806 | 9,936 | 0 | 0 |
| 29 | Total Liabilities + | 3,240 | 2,286 | 1,784 | 1,769 | 689 | 581 | 312 | 1,057 | 671 | 609 | 774 | 731 | 856 | 0 | 0 |
| 30 | Stockholders' Equity Attributable to Noncontrolling Interest + | 18 | 17 | 25 | 24 | 30 | 27 | 26 | 27 | 29 | 23 | 32 | 133 | 358 | 0 | 0 |
| 31 | Total Stockholders' Equity + | 8,577 | 9,080 | 9,145 | 8,964 | 9,442 | 9,198 | 9,507 | 8,819 | 8,123 | 8,311 | 8,709 | 9,061 | 9,067 | 9,263 | 8,707 |
| 32 | Total Liabilities and Equity + | 11,817 | 11,365 | 10,928 | 10,733 | 10,130 | 9,778 | 9,819 | 9,876 | 8,793 | 8,933 | 9,495 | 9,806 | 9,936 | 0 | 0 |
Year | 2020 | 2019 | 2018 | 2017 | 2016 | 2015 | 2014 | 2013 | 2012 | 2011 | 2010 | 2009 | 2008 | 2007 | |
|---|---|---|---|---|---|---|---|---|---|---|---|---|---|---|---|
| 1 | 2,915 | 2,847 | 2,754 | 2,669 | 2,561 | 2,382 | 2,195 | 1,982 | 1,827 | 1,752 | 1,647 | 1,628 | 1,724 | 1,787 | |
| 2 | 60 | 44 | 44 | 50 | 51 | 49 | 46 | 36 | 0 | 0 | 0 | 0 | 0 | 0 | |
| 3 | 0 | -173 | -740 | -708 | -669 | -636 | -613 | -560 | 0 | 0 | 0 | 0 | 0 | 0 | |
| 4 | 0 | 0 | 2,015 | 1,961 | 1,891 | 1,746 | 1,564 | 1,405 | 0 | 0 | 0 | 0 | 0 | 0 | |
| 5 | 553 | 513 | 484 | 455 | 433 | 426 | 437 | 387 | 358 | 358 | 354 | 340 | 412 | 620 | |
| 6 | 0 | 0 | 0 | 0 | 0 | 0 | 0 | 0 | 0 | 121 | 117 | 0 | 0 | 0 | |
| 7 | 83 | 72 | 119 | 83 | 84 | 88 | 71 | 67 | 57 | 52 | 38 | 36 | 63 | 60 | |
| 8 | 0 | 0 | 0 | 0 | 0 | 0 | 0 | 0 | 0 | 6 | 0 | 3 | 0 | 0 | |
| 9 | 1 | 0 | 38 | 1 | 1 | 19 | 2 | 0 | 0 | 0 | 0 | 0 | 0 | 0 | |
| 10 | 0 | 0 | 0 | 1,423 | 1,374 | 1,232 | 1,068 | 963 | 872 | 763 | 693 | 0 | 0 | 0 | |
| 11 | 0 | 0 | 152 | 0 | 0 | 0 | 0 | 0 | 0 | 0 | 0 | 0 | 0 | 0 | |
| 12 | 0 | 0 | 304 | 0 | 0 | 0 | 0 | 0 | 0 | 0 | 0 | 0 | 0 | 0 | |
| 13 | 22 | 28 | 26 | 19 | 15 | 17 | 5 | 23 | 22 | 32 | 29 | 30 | 36 | 11 | |
| 14 | 0 | 0 | 0 | -8 | 0 | 0 | 0 | 0 | 0 | 0 | 0 | 0 | 1 | -3 | |
| 15 | 0 | 0 | 0 | 0 | 0 | 0 | -7 | 17 | 9 | -7 | -42 | 10 | -24 | 55 | |
| 16 | 0 | 0 | 0 | 0 | 0 | 0 | 146 | 132 | 124 | 114 | 104 | 108 | 108 | 115 | |
| 17 | 0 | 0 | 0 | 0 | 0 | 0 | 94 | 91 | 86 | 77 | 70 | 72 | 71 | 63 | |
| 18 | 56 | 46 | 33 | 13 | 4 | 1 | 7 | 6 | 20 | 24 | 30 | 30 | 44 | 64 | |
| 19 | 0 | 0 | 0 | 0 | 0 | 0 | 0 | 0 | 0 | 0 | 0 | -4 | 0 | 0 | |
| 20 | 0 | 0 | 0 | 0 | 0 | 0 | 0 | 0 | 0 | 774 | 694 | 698 | 650 | 0 | |
| 21 | 80 | 70 | 103 | 76 | 57 | 51 | 88 | 58 | 46 | 59 | 38 | 53 | 20 | 13 | |
| 22 | 0 | 0 | 0 | 0 | 0 | 0 | 1,150 | 1,058 | 930 | 834 | 689 | 799 | 980 | 489 | |
| 23 | 0 | 0 | 0 | 0 | 0 | 0 | 0 | 0 | 12 | 3 | 8 | 6 | 0 | 0 | |
| 24 | 1,361 | 1,526 | 1,717 | 1,448 | 1,460 | 1,318 | 1,150 | 1,058 | 943 | 836 | 696 | 790 | 974 | 487 | |
| 25 | 0 | 0 | 0 | 0 | 0 | 0 | 6 | 6 | 5 | 0 | 0 | 0 | 0 | 0 | |
| 26 | 0 | 0 | 0 | 0 | 0 | 0 | 0 | 0 | 0 | 1 | 1 | 1 | 0 | 0 | |
| 27 | 0 | 0 | 0 | 0 | 0 | 0 | 0 | 0 | 0 | -3 | 0 | 0 | 0 | 0 | |
| 28 | Total Net Income (Loss) Attributable to Parent + | 1,357 | 1,521 | 1,711 | 1,442 | 1,454 | 1,311 | 1,144 | 1,052 | 939 | 824 | 672 | 835 | 935 | 458 |
| 29 | Preferred Stock Dividends + | 207 | 210 | 216 | 237 | 238 | 245 | 233 | 204 | 0 | 0 | 0 | 0 | 0 | 0 |
| 30 | Preferred Stock Redemption Premium + | 255 | 243 | 0 | 266 | 265 | 254 | 0 | 0 | 62 | 36 | 8 | 0 | 0 | 0 |
| 31 | 1,098 | 1,273 | 1,489 | 1,172 | 1,184 | 1,053 | 908 | 845 | 670 | 562 | 399 | 586 | 0 | 0 | |
| 32 | Income (Loss) from Continuing Operations + | 0 | 0 | 0 | 0 | 0 | 0 | 1,150 | 1,058 | 930 | 834 | 689 | 799 | 980 | 489 |
| 33 | Total Income (Loss) from Continuing Operations + | 0 | 0 | 0 | 0 | 0 | 0 | 2,058 | 1,903 | 1,587 | 1,392 | 1,080 | 0 | 0 | 0 |
| 34 | Total Income (Loss) from Discontinued Operations + | 0 | 0 | 0 | 0 | 0 | 0 | 0 | 0 | 13 | 2 | 7 | -7 | 0 | 0 |
| 35 | Income (Loss) from Continuing Operations + | 0 | 0 | 0 | 0 | 0 | 0 | 5.27 | 4.92 | 3.85 | 3.30 | 2.32 | 3.53 | 4.23 | 1.19 |
| 36 | 0 | 0 | 0 | 0 | 0 | 0 | 0 | 0 | 0.08 | 0.01 | 0.04 | -0.04 | 0 | 0 | |
| 37 | Total Earnings Per Share + | 6.29 | 7.30 | 8.56 | 6.75 | 6.84 | 6.10 | 5.27 | 4.92 | 3.93 | 3.31 | 2.36 | 3.48 | 4.19 | 1.18 |
| 38 | Income (Loss) from Continuing Operations + | 0 | 0 | 0 | 0 | 0 | 0 | 5.27 | 4.92 | 3.85 | 3.30 | 2.32 | 3.53 | 4.23 | 1.19 |
| 39 | Income (Loss) from Continuing Operations + | 0 | 0 | 0 | 0 | 0 | 0 | 5.25 | 4.89 | 3.83 | 3.28 | 2.31 | 3.52 | 4.22 | 1.18 |
| 40 | 0 | 0 | 0 | 0 | 0 | 0 | 0 | 0 | 0.07 | 0.01 | 0.04 | -0.04 | 0 | 0 | |
| 41 | Total Earnings Per Share + | 6.29 | 7.29 | 8.54 | 6.73 | 6.81 | 6.07 | 5.25 | 4.89 | 3.90 | 3.29 | 2.35 | -0.05 | -0.04 | -0.01 |
| 42 | 8 | 8 | 8 | 8 | 7.30 | 6.50 | 5.60 | 5.15 | 4.40 | 3.65 | 3.05 | 2.20 | 2.80 | 0 | |
| 43 | 0 | 0 | 0 | 16 | 14.60 | 13 | 11.20 | 10.30 | 8.80 | 7.30 | 6.10 | 4.40 | 5.60 | 0 | |
| 44 | Income (Loss) Attributable to Noncontrolling Interest + | 4 | 5 | 6 | 6 | 7 | 6 | 6 | 5 | 4 | 13 | 24 | 0 | 0 | 0 |
 Click to Enlarge