| Date | Price $ | Result % | Candle Name | Side |
|---|---|---|---|---|
| 001 01 Apr 2024 | Sell Price: 124.73 | Profit: Close Day1 ($ 123.06) | Abandoned Baby | Sell |
| 002 20 Feb 2024 | Buy Price: 125.88 | Profit: Close Day1 ($ 126.08) | Abandoned Baby | Buy |
| 003 06 Feb 2024 | Buy Price: 132.21 | Profit: Open Day1 ($ 132.86) | Engulfing | Buy |
| 004 02 Feb 2024 | Sell Price: 132.70 | Profit: Open Day1 ($ 132.19) | Engulfing | Sell |
| 005 30 Jan 2024 | Buy Price: 132.94 | Profit: Open Day1 ($ 133.17) | Engulfing | Buy |
| 006 03 Nov 2023 | Sell Price: 113.34 | Profit: Open Day1 ($ 113.32) | Engulfing | Sell |
| 007 03 Nov 2023 | Sell Price: 113.47 | Profit: Open Day1 ($ 113.32) | Dark Cloud Cover | Sell |
| 008 10 Oct 2023 | Buy Price: 115.96 | Profit: Open Day1 ($ 116.31) | Abandoned Baby | Buy |
| 009 18 Jul 2023 | Sell Price: 147.72 | Loss: Close Day2 ($ 152.48) | Dark Cloud Cover | Sell |
| 010 13 Jul 2023 | Buy Price: 147.61 | Profit: Open Day1 ($ 149.07) | Engulfing | Buy |
| 011 20 Jun 2023 | Sell Price: 151.34 | Loss: Close Day2 ($ 152.02) | Engulfing | Sell |
| 012 02 Jun 2023 | Buy Price: 148.98 | Profit: Open Day1 ($ 150.14) | Engulfing | Buy |
| 013 31 May 2023 | Buy Price: 146.59 | Profit: Open Day1 ($ 147.07) | Abandoned Baby | Buy |
| 014 12 May 2023 | Buy Price: 158.15 | Profit: Open Day1 ($ 158.37) | Engulfing | Buy |
| 015One Year Average | Both Sides Result for 14 Signals |
Profit: $ 1.66 ($ 0.12 / Signal) |
All of Them | Buy + Sell |
| Simple Moving Averages (SMA) Period | Value $ | Signal | Exponential Moving Averages (EMA) Period | Value $ | Signal | |
|---|---|---|---|---|---|---|
| 2 | 114.39 | SELL | 2 | 114.45 | SELL | |
| 3 | 115.78 | SELL | 3 | 114.96 | SELL | |
| 5 | 116.50 | SELL | 5 | 115.17 | SELL | |
| 8 | 114.77 | SELL | 8 | 115.02 | SELL | |
| 13 | 113.35 | BUY | 13 | 115.22 | SELL | |
| 21 | 116.00 | SELL | 21 | 116.19 | SELL | |
| 34 | 118.82 | SELL | 34 | 117.82 | SELL | |
| 55 | 120.82 | SELL | 55 | 119.63 | SELL | |
| 90 | 123.94 | SELL | 90 | 121.47 | SELL | |
| 200 | 126.22 | SELL | 200 | 126.64 | SELL |
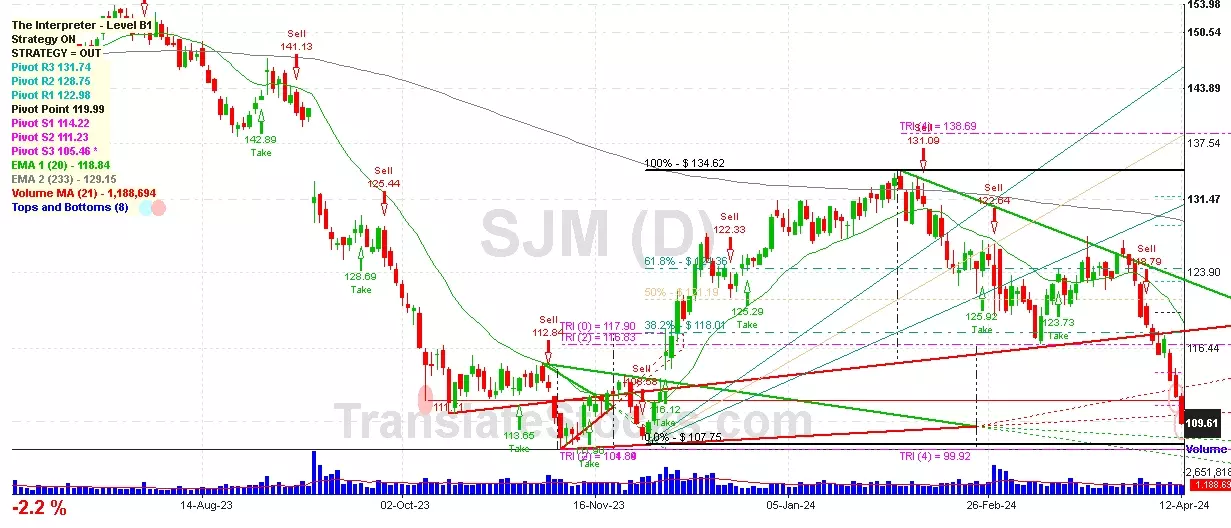
Jm Smucker Co/the
IPO: 1965-10-20
Ticker: SJMIndices: S&P 500,
Exchange: New York Stock Exchange, Inc. (US - USD)
Website: https://www.jmsmucker.com/
Phone:
Common Stock
Manufacturing (
Canned, Fruits, Veg, Preserves, Jams & Jellies

 Click to Enlarge