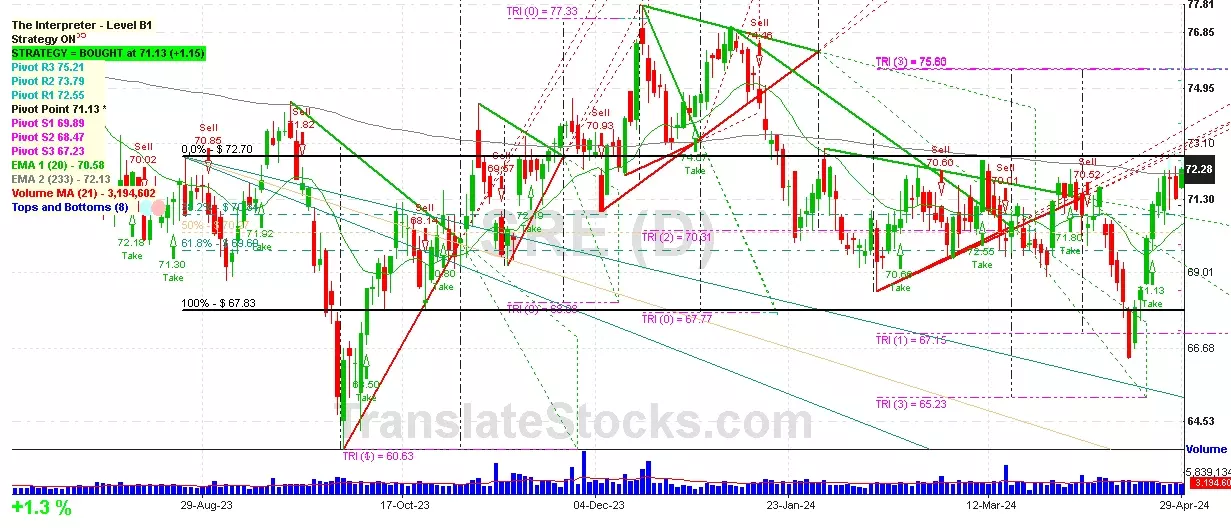
Hey Friend, I'm analysing SEMPRA ENERGY (SRE), and it is between the Support of $ 71.13 (Pivot) and the Resistance of $ 72.55 (PivotR1). The stock is also approaching the line of PivotR1 at $ 72.55, and if it goes above this line it could reach the next Resistance of 0% of Fibonacci at $ 72.70.

| Date | Price $ | Result % | Candle Name | Side |
|---|---|---|---|---|
| 001 03 Apr 2024 | Sell Price: 70.97 | Profit: Close Day1 ($ 70.84) | Engulfing | Sell |
| 002 20 Mar 2024 | Sell Price: 69.77 | Profit: Open Day1 ($ 69.76) | Abandoned Baby | Sell |
| 003 04 Mar 2024 | Buy Price: 70.74 | Profit: Open Day1 ($ 70.88) | Engulfing | Buy |
| 004 31 Jan 2024 | Sell Price: 71.56 | Profit: Open Day1 ($ 71.40) | Dark Cloud Cover | Sell |
| 005 20 Nov 2023 | Buy Price: 72.43 | Profit: Open Day1 ($ 72.58) | Piercing Line | Buy |
| 006 30 Aug 2023 | Sell Price: 70.85 | Profit: Close Day1 ($ 70.22) | Abandoned Baby | Sell |
| 007 24 Aug 2023 | Sell Price: 70.78 | Loss: Close Day2 ($ 71.56) | Abandoned Baby | Sell |
| 008 11 Aug 2023 | Buy Price: 144.35 | Loss: Close Day2 ($ 140.04) | Engulfing | Buy |
| 009 16 Jun 2023 | Sell Price: 148.20 | Profit: Open Day1 ($ 147.76) | Dark Cloud Cover | Sell |
| 010 14 Jun 2023 | Buy Price: 147.29 | Profit: Open Day1 ($ 147.88) | Abandoned Baby | Buy |
| 011 19 May 2023 | Sell Price: 145.82 | Profit: Open Day2 ($ 145.80) | Engulfing | Sell |
| 012 19 May 2023 | Sell Price: 146.11 | Profit: Open Day1 ($ 145.89) | Dark Cloud Cover | Sell |
| 013One Year Average | Both Sides Result for 12 Signals |
Loss: $ -2.60 ($ -0.22 / Signal) |
All of Them | Buy + Sell |
| Simple Moving Averages (SMA) Period | Value $ | Signal | Exponential Moving Averages (EMA) Period | Value $ | Signal | |
|---|---|---|---|---|---|---|
| 2 | 71.80 | BUY | 2 | 72.03 | BUY | |
| 3 | 71.86 | BUY | 3 | 71.90 | BUY | |
| 5 | 71.83 | BUY | 5 | 71.60 | BUY | |
| 8 | 71.10 | BUY | 8 | 71.18 | BUY | |
| 13 | 69.94 | BUY | 13 | 70.79 | BUY | |
| 21 | 70.35 | BUY | 21 | 70.57 | BUY | |
| 34 | 70.37 | BUY | 34 | 70.55 | BUY | |
| 55 | 70.50 | BUY | 55 | 70.88 | BUY | |
| 90 | 71.58 | BUY | 90 | 72.65 | SELL | |
| 200 | 71.57 | BUY | 200 | 85.25 | SELL |
Sempra Energy
IPO: 1998-06-29
Ticker: SREIndices: S&P 500,
Exchange: New York Stock Exchange, Inc. (US - USD)
Website: https://www.sempra.com/
Phone:
Common Stock
Energy & Transportation (
Gas & Other Services Combined
 Click to Enlarge