| Date | Price $ | Result % | Candle Name | Side |
|---|---|---|---|---|
| 001 16 Jan 2024 | Sell Price: 151.16 | Profit: Open Day1 ($ 149.39) | Abandoned Baby | Sell |
| 002 24 Nov 2023 | Buy Price: 154.63 | Loss: Close Day2 ($ 153.99) | Abandoned Baby | Buy |
| 003 05 Jun 2023 | Sell Price: 130.32 | Profit: Open Day1 ($ 128.00) | Engulfing | Sell |
| 004 05 Jun 2023 | Sell Price: 130.38 | Profit: Open Day1 ($ 128.00) | Dark Cloud Cover | Sell |
| 005One Year Average | Both Sides Result for 4 Signals |
Profit: $ 5.83 ($ 1.46 / Signal) |
All of Them | Buy + Sell |
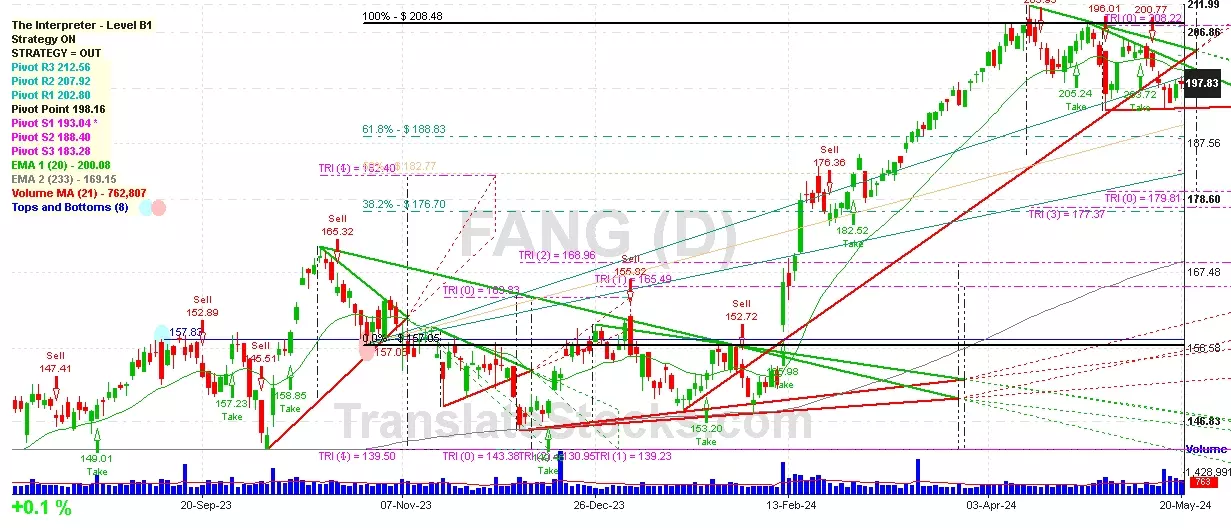
| Simple Moving Averages (SMA) Period | Value $ | Signal | Exponential Moving Averages (EMA) Period | Value $ | Signal | |
|---|---|---|---|---|---|---|
| 2 | 197.75 | BUY | 2 | 197.54 | BUY | |
| 3 | 196.70 | BUY | 3 | 197.45 | BUY | |
| 5 | 196.98 | BUY | 5 | 197.78 | BUY | |
| 8 | 198.95 | SELL | 8 | 198.53 | SELL | |
| 13 | 200.14 | SELL | 13 | 199.50 | SELL | |
| 21 | 201.52 | SELL | 21 | 200.09 | SELL | |
| 34 | 202.47 | SELL | 34 | 199.01 | SELL | |
| 55 | 197.75 | BUY | 55 | 194.89 | BUY | |
| 90 | 183.91 | BUY | 90 | 187.59 | BUY | |
| 200 | 167.96 | BUY | 200 | 172.28 | BUY |
Diamondback Energy Inc
IPO: 2012-10-12
Ticker: FANGIndices: S&P 500,
Exchange: Nasdaq Nms - Global Market (US - USD)
Website: https://ir.diamondbackenergy.com/
Phone:
Common Stock
Energy & Transportation (
Crude Petroleum & Natural Gas

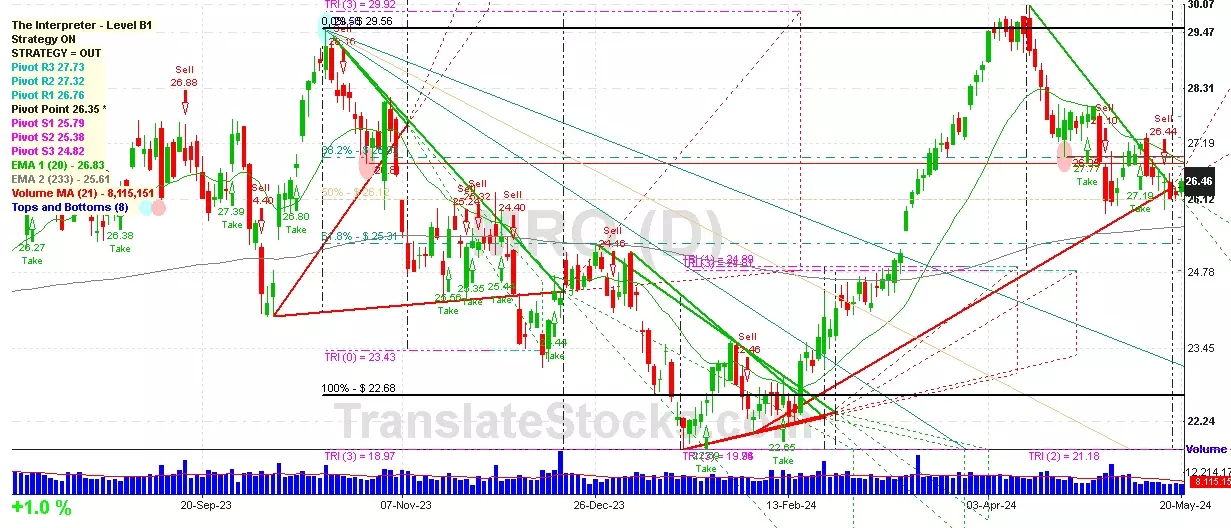
 Click to Enlarge
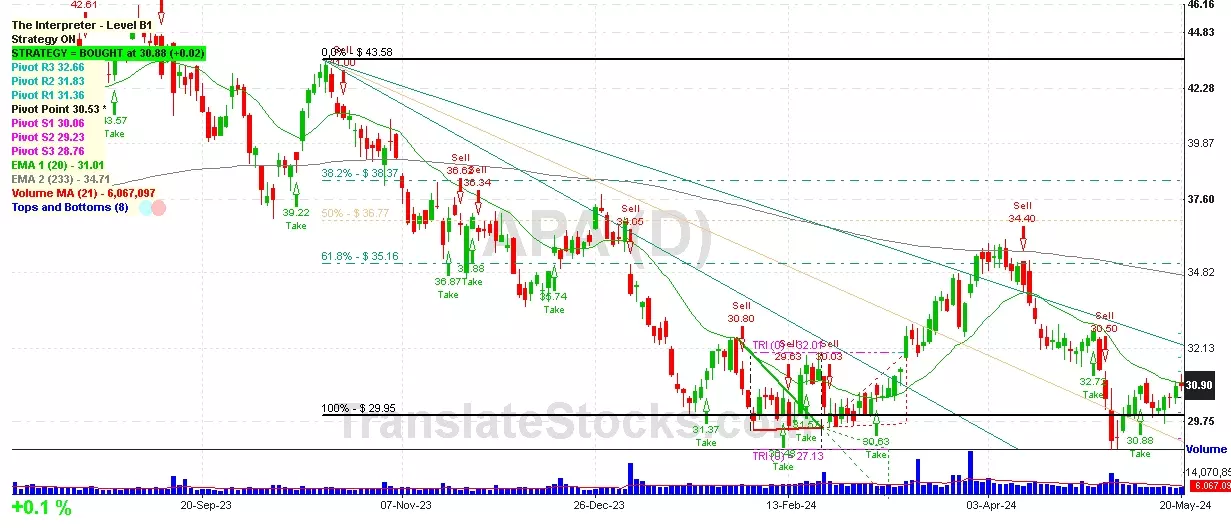