| Date | Price $ | Result % | Candle Name | Side |
|---|---|---|---|---|
| 001 08 Apr 2024 | Sell Price: 29.49 | Profit: Close Day1 ($ 29.28) | Engulfing | Sell |
| 002 22 Mar 2024 | Sell Price: 27.10 | Loss: Close Day2 ($ 27.44) | Engulfing | Sell |
| 003 06 Mar 2024 | Buy Price: 24.52 | Profit: Close Day1 ($ 24.66) | Abandoned Baby | Buy |
| 004 20 Feb 2024 | Sell Price: 23.17 | Loss: Close Day2 ($ 23.98) | Abandoned Baby | Sell |
| 005 21 Nov 2023 | Sell Price: 25.31 | Profit: Open Day1 ($ 24.53) | Abandoned Baby | Sell |
| 006 31 Aug 2023 | Sell Price: 26.35 | Loss: Close Day2 ($ 27.16) | Dark Cloud Cover | Sell |
| 007 03 Aug 2023 | Buy Price: 25.78 | Profit: Open Day1 ($ 26.02) | Piercing Line | Buy |
| 008One Year Average | Both Sides Result for 7 Signals |
Loss: $ -0.59 ($ -0.08 / Signal) |
All of Them | Buy + Sell |
| Simple Moving Averages (SMA) Period | Value $ | Signal | Exponential Moving Averages (EMA) Period | Value $ | Signal | |
|---|---|---|---|---|---|---|
| 2 | 27.64 | BUY | 2 | 27.69 | BUY | |
| 3 | 27.70 | BUY | 3 | 27.69 | BUY | |
| 5 | 27.65 | BUY | 5 | 27.73 | BUY | |
| 8 | 27.71 | BUY | 8 | 27.87 | SELL | |
| 13 | 28.30 | SELL | 13 | 28.01 | SELL | |
| 21 | 28.55 | SELL | 21 | 27.93 | SELL | |
| 34 | 27.80 | SELL | 34 | 27.47 | BUY | |
| 55 | 26.23 | BUY | 55 | 26.76 | BUY | |
| 90 | 25.15 | BUY | 90 | 26.13 | BUY | |
| 200 | 25.65 | BUY | 200 | 25.55 | BUY |
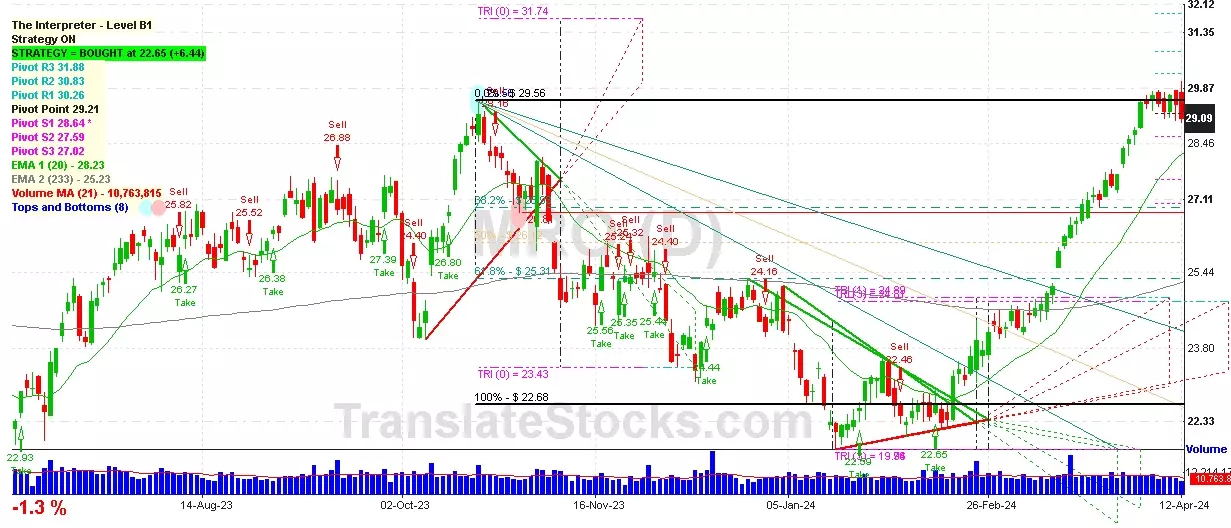
Marathon Oil Corp
IPO: 1965-11-26
Ticker: MROIndices: S&P 500,
Exchange: New York Stock Exchange, Inc. (US - USD)
Website: https://www.marathonoil.com/
Phone:
Common Stock
Energy & Transportation (
Crude Petroleum & Natural Gas

 Click to Enlarge