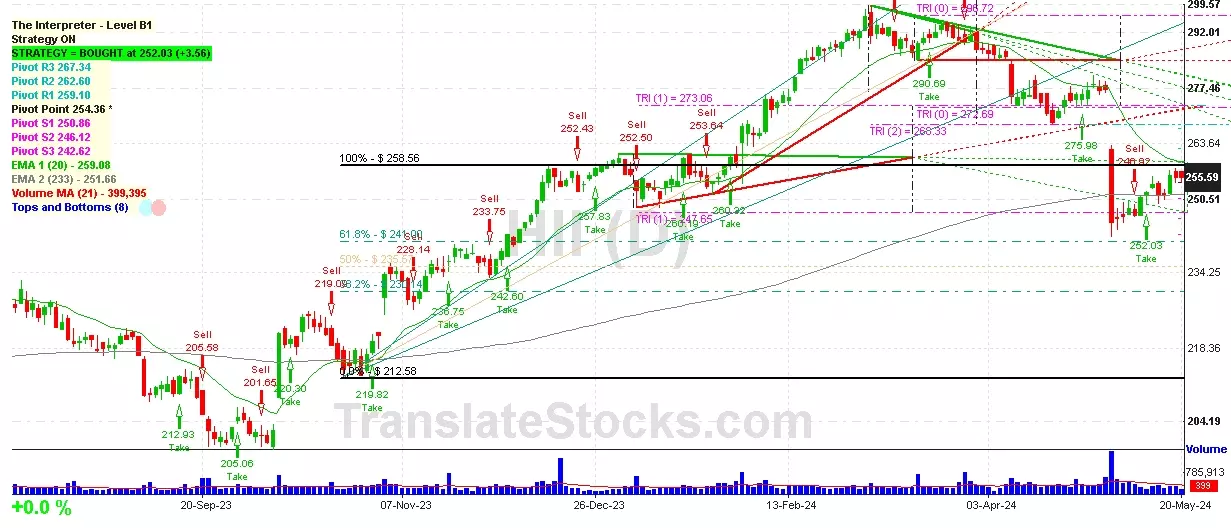
Hey Friend, I'm analysing HUNTINGTON INGALLS INDUSTRIE (HII), and it is between the Support of $ 254.36 (Pivot) and the Resistance of $ 258.56 (100% of Fibonacci). The stock is also approaching the line of Pivot at $ 254.36, and if it goes below this line it could reach the next Support of Triangle projection at $247.65.

| Date | Price $ | Result % | Candle Name | Side |
|---|---|---|---|---|
| 001 14 May 2024 | Sell Price: 251.51 | Loss: Close Day2 ($ 256.16) | Engulfing | Sell |
| 002 01 Apr 2024 | Sell Price: 287.60 | Profit: Close Day1 ($ 287.47) | Engulfing | Sell |
| 003 15 Mar 2024 | Buy Price: 289.02 | Profit: Open Day1 ($ 289.42) | Engulfing | Buy |
| 004 15 Mar 2024 | Buy Price: 288.29 | Profit: Open Day1 ($ 289.42) | Piercing Line | Buy |
| 005 06 Feb 2024 | Buy Price: 266.22 | Profit: Open Day1 ($ 266.62) | Piercing Line | Buy |
| 006 31 Jan 2024 | Sell Price: 258.92 | Loss: Close Day2 ($ 268.50) | Dark Cloud Cover | Sell |
| 007 29 Sep 2023 | Sell Price: 204.91 | Profit: Open Day1 ($ 204.34) | Engulfing | Sell |
| 008 29 Sep 2023 | Sell Price: 204.58 | Profit: Open Day1 ($ 204.34) | Dark Cloud Cover | Sell |
| 009 13 Sep 2023 | Sell Price: 209.52 | Loss: Close Day2 ($ 211.65) | Engulfing | Sell |
| 010 25 Aug 2023 | Buy Price: 218.55 | Profit: Open Day1 ($ 218.57) | Abandoned Baby | Buy |
| 011 12 Jul 2023 | Sell Price: 229.59 | Profit: Open Day1 ($ 228.62) | Dark Cloud Cover | Sell |
| 012 26 Jun 2023 | Buy Price: 218.58 | Profit: Close Day1 ($ 221.18) | Engulfing | Buy |
| 013 20 Jun 2023 | Sell Price: 218.47 | Profit: Close Day2 ($ 217.95) | Engulfing | Sell |
| 014 14 Jun 2023 | Sell Price: 215.32 | Loss: Close Day2 ($ 221.18) | Dark Cloud Cover | Sell |
| 015One Year Average | Both Sides Result for 14 Signals |
Loss: $ -15.24 ($ -1.09 / Signal) |
All of Them | Buy + Sell |
| Simple Moving Averages (SMA) Period | Value $ | Signal | Exponential Moving Averages (EMA) Period | Value $ | Signal | |
|---|---|---|---|---|---|---|
| 2 | 255.60 | SELL | 2 | 255.49 | BUY | |
| 3 | 255.78 | SELL | 3 | 255.19 | BUY | |
| 5 | 254.10 | BUY | 5 | 254.57 | BUY | |
| 8 | 253.43 | BUY | 8 | 254.43 | BUY | |
| 13 | 250.84 | BUY | 13 | 255.92 | SELL | |
| 21 | 260.53 | SELL | 21 | 259.53 | SELL | |
| 34 | 267.03 | SELL | 34 | 264.42 | SELL | |
| 55 | 276.13 | SELL | 55 | 267.89 | SELL | |
| 90 | 274.06 | SELL | 90 | 266.87 | SELL | |
| 200 | 248.84 | BUY | 200 | 254.79 | BUY |
Huntington Ingalls Industrie
IPO: 2011-03-19
Ticker: HIIIndices: S&P 500,
Exchange: New York Stock Exchange, Inc. (US - USD)
Website: https://www.huntingtoningalls.com/
Phone:
Common Stock
Manufacturing (
Ship & Boat Building & Repairing
 Click to Enlarge