| Date | Price $ | Result % | Candle Name | Side |
|---|---|---|---|---|
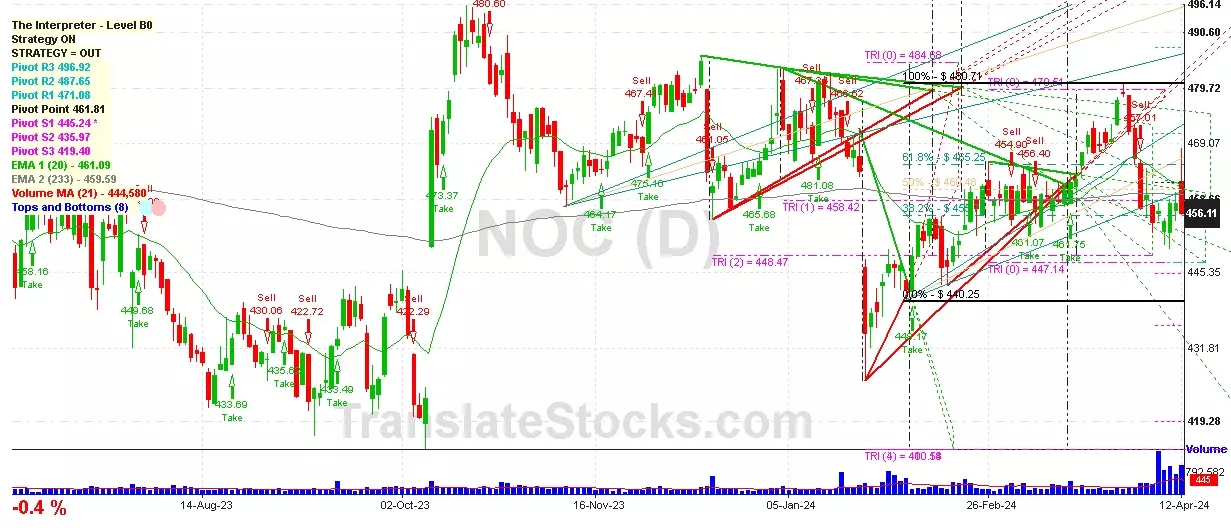
| 001 18 Apr 2024 | Buy Price: 452.50 | Profit: Open Day1 ($ 455.59) | Piercing Line | Buy |
| 002 01 Apr 2024 | Sell Price: 471.35 | Profit: Close Day1 ($ 466.36) | Abandoned Baby | Sell |
| 003 08 Mar 2024 | Buy Price: 459.50 | Loss: Close Day2 ($ 458.84) | Engulfing | Buy |
| 004 08 Mar 2024 | Buy Price: 459.41 | Profit: Open Day1 ($ 459.48) | Piercing Line | Buy |
| 005 05 Mar 2024 | Sell Price: 458.26 | Profit: Open Day1 ($ 458.16) | Dark Cloud Cover | Sell |
| 006 02 Feb 2024 | Buy Price: 446.58 | Profit: Close Day2 ($ 448.17) | Piercing Line | Buy |
| 007 04 Jan 2024 | Sell Price: 471.73 | Profit: Close Day1 ($ 469.89) | Engulfing | Sell |
| 008 04 Jan 2024 | Sell Price: 473.16 | Profit: Open Day1 ($ 472.72) | Dark Cloud Cover | Sell |
| 009 19 Oct 2023 | Sell Price: 489.94 | Profit: Close Day1 ($ 485.70) | Abandoned Baby | Sell |
| 010 31 Aug 2023 | Sell Price: 433.09 | Profit: Close Day2 ($ 431.08) | Dark Cloud Cover | Sell |
| 011 23 Aug 2023 | Sell Price: 434.11 | Profit: Close Day1 ($ 432.18) | Engulfing | Sell |
| 012 23 Aug 2023 | Sell Price: 434.52 | Profit: Open Day1 ($ 434.21) | Dark Cloud Cover | Sell |
| 013 31 Jul 2023 | Sell Price: 445.00 | Loss: Close Day2 ($ 447.47) | Engulfing | Sell |
| 014 20 Jul 2023 | Buy Price: 454.36 | Loss: Close Day2 ($ 452.21) | Abandoned Baby | Buy |
| 015 12 Jul 2023 | Sell Price: 453.35 | Profit: Open Day1 ($ 452.29) | Engulfing | Sell |
| 016 28 Jun 2023 | Sell Price: 442.66 | Loss: Close Day2 ($ 455.80) | Engulfing | Sell |
| 017 09 Jun 2023 | Sell Price: 454.26 | Profit: Open Day1 ($ 453.96) | Dark Cloud Cover | Sell |
| 018One Year Average | Both Sides Result for 17 Signals |
Profit: $ 3.54 ($ 0.21 / Signal) |
All of Them | Buy + Sell |
| Simple Moving Averages (SMA) Period | Value $ | Signal | Exponential Moving Averages (EMA) Period | Value $ | Signal | |
|---|---|---|---|---|---|---|
| 2 | 481.32 | BUY | 2 | 483.29 | BUY | |
| 3 | 479.10 | BUY | 3 | 480.03 | BUY | |
| 5 | 474.17 | BUY | 5 | 475.09 | BUY | |
| 8 | 465.72 | BUY | 8 | 470.44 | BUY | |
| 13 | 461.81 | BUY | 13 | 466.79 | BUY | |
| 21 | 463.08 | BUY | 21 | 464.60 | BUY | |
| 34 | 463.51 | BUY | 34 | 463.17 | BUY | |
| 55 | 460.45 | BUY | 55 | 462.26 | BUY | |
| 90 | 461.02 | BUY | 90 | 461.54 | BUY | |
| 200 | 456.58 | BUY | 200 | 460.41 | BUY |
Northrop Grumman Corp
IPO: 1951-12-10
Ticker: NOCIndices: S&P 500,
Exchange: New York Stock Exchange, Inc. (US - USD)
Website: http://www.northropgrumman.com/
Phone:
Common Stock
Manufacturing (
Search, Detection, Navagation, Guidance, Aeronautical Sys

 Click to Enlarge