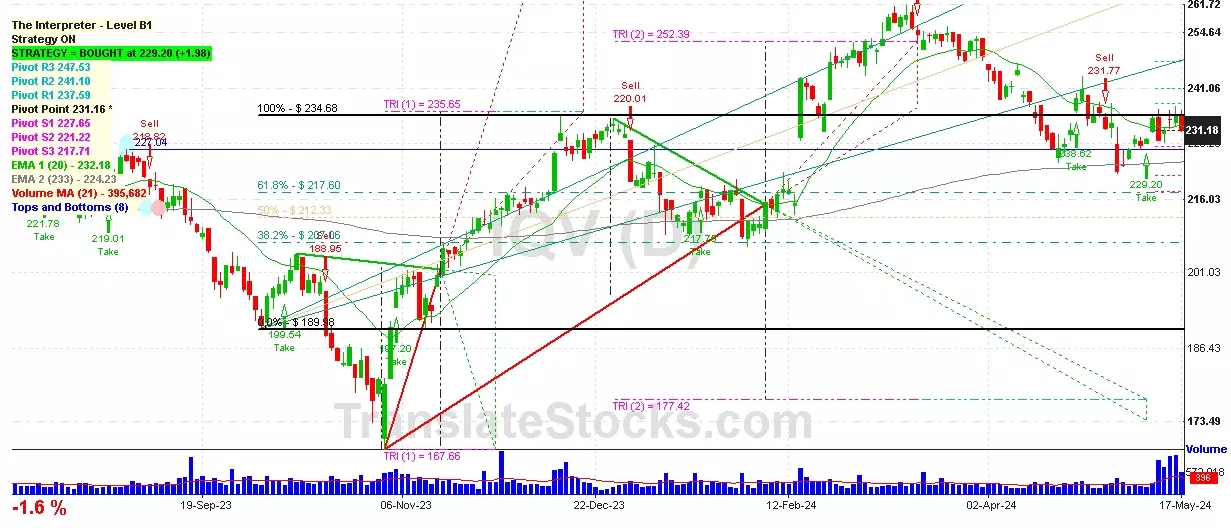
Hey Friend, I'm analysing IQVIA HOLDINGS INC (IQV), and it is between the Support of $ 231.16 (Pivot) and the Resistance of $ 234.68 (100% of Fibonacci). The stock is also approaching the line of Pivot at $ 231.16, and if it goes below this line it could reach the next Support of 61.8% of Fibonacci at $ 217.60.

| Date | Price $ | Result % | Candle Name | Side |
|---|---|---|---|---|
| 001 22 Mar 2024 | Sell Price: 252.41 | Profit: Close Day1 ($ 248.88) | Engulfing | Sell |
| 002 20 Mar 2024 | Sell Price: 252.72 | Profit: Close Day2 ($ 252.41) | Engulfing | Sell |
| 003 13 Mar 2024 | Sell Price: 255.65 | Profit: Open Day1 ($ 255.11) | Engulfing | Sell |
| 004 23 Jan 2024 | Sell Price: 213.53 | Profit: Close Day1 ($ 212.88) | Abandoned Baby | Sell |
| 005 29 Dec 2023 | Sell Price: 231.38 | Profit: Open Day1 ($ 229.66) | Abandoned Baby | Sell |
| 006 20 Dec 2023 | Sell Price: 225.00 | Loss: Close Day2 ($ 229.37) | Engulfing | Sell |
| 007 24 Aug 2023 | Sell Price: 215.51 | Loss: Close Day2 ($ 221.79) | Engulfing | Sell |
| 008 22 Aug 2023 | Sell Price: 214.02 | Loss: Close Day2 ($ 215.51) | Engulfing | Sell |
| 009 14 Aug 2023 | Buy Price: 220.12 | Loss: Close Day2 ($ 215.20) | Piercing Line | Buy |
| 010One Year Average | Both Sides Result for 9 Signals |
Loss: $ -10.31 ($ -1.15 / Signal) |
All of Them | Buy + Sell |
| Simple Moving Averages (SMA) Period | Value $ | Signal | Exponential Moving Averages (EMA) Period | Value $ | Signal | |
|---|---|---|---|---|---|---|
| 2 | 233.09 | SELL | 2 | 232.19 | SELL | |
| 3 | 233.29 | SELL | 3 | 232.37 | SELL | |
| 5 | 232.01 | SELL | 5 | 232.13 | SELL | |
| 8 | 231.40 | SELL | 8 | 231.67 | SELL | |
| 13 | 229.68 | BUY | 13 | 231.50 | SELL | |
| 21 | 231.47 | SELL | 21 | 232.32 | SELL | |
| 34 | 233.60 | SELL | 34 | 233.96 | SELL | |
| 55 | 241.17 | SELL | 55 | 234.67 | SELL | |
| 90 | 234.39 | SELL | 90 | 232.69 | SELL | |
| 200 | 220.73 | BUY | 200 | 225.36 | BUY |
Iqvia Holdings Inc
IPO: 2013-05-09
Ticker: IQVIndices: S&P 500,
Exchange: New York Stock Exchange, Inc. (US - USD)
Website: https://ir.iqvia.com/
Phone:
Common Stock
Trade & Services (
Services-commercial Physical & Biological Research
Year | 2020 | 2019 | 2018 | 2017 | 2016 | 2015 | 2014 | 2013 | 2012 | 2011 | 2010 | |
|---|---|---|---|---|---|---|---|---|---|---|---|---|
| 1 | Assets + | 24,564 | 23,251 | 22,549 | 22,742 | 21,208 | 3,926 | 3,306 | 3,067 | 2,499 | 2,323 | 647 |
| 2 | Investments in and Advance to Affiliates + | 84 | 87 | 101 | 70 | 1 | 27 | 0 | 0 | 0 | 0 | 0 |
| 3 | Cash and Cash Equivalents + | 1,814 | 837 | 891 | 959 | 1,198 | 977 | 867 | 778 | 568 | 516 | 647 |
| 4 | Property + | 482 | 458 | 434 | 440 | 406 | 188 | 190 | 200 | 194 | 0 | 0 |
| 5 | Property + | 1,155 | 1,055 | 1,001 | 923 | 769 | 510 | 496 | 481 | 451 | 0 | 0 |
| 6 | Intangible Assets + | 5,205 | 5,514 | 5,951 | 6,591 | 6,390 | 368 | 280 | 298 | 273 | 0 | 0 |
| 7 | Finite-Lived Intangible Assets + | 5,187 | 5,496 | 5,933 | 6,573 | 6,263 | 240 | 171 | 188 | 163 | 0 | 0 |
| 8 | Liabilities and Equity + | 24,564 | 23,251 | 22,549 | 22,742 | 21,208 | 3,926 | 3,306 | 3,067 | 2,499 | -970 | -900 |
| 9 | Liabilities + | 18,284 | 16,988 | 15,595 | 14,384 | 12,348 | 4,262 | 4,010 | 3,734 | 3,858 | 0 | 0 |
| 10 | Stockholders' Equity + | 6,280 | 6,263 | 6,954 | 8,244 | 8,860 | -336 | -704 | -667 | -1,359 | -970 | -900 |
| 11 | Stockholders' Equity Attributable to Parent + | 6,001 | 6,003 | 6,714 | 8,109 | 8,633 | -564 | -704 | -667 | -1,360 | 0 | 0 |
| 12 | Stockholders' Equity + | 0.02 | 0.02 | 0.02 | 0.02 | 0.02 | 0.02 | 0.02 | 0.02 | 0.01 | 0 | 0 |
| 13 | Preferred Stock + | 0.01 | 0.01 | 0.01 | 0.01 | 0.01 | 0.01 | 0.01 | 0.01 | 0 | 0 | 0 |
| 14 | Common Stock + | 0.01 | 0.01 | 0.01 | 0.01 | 0.01 | 0.01 | 0.01 | 0.01 | 0.01 | 0 | 0 |
| 15 | Partners' Capital + | 1,277 | 998 | 807 | 655 | -399 | -462 | -789 | -1,145 | -1,372 | 23 | 46 |
| 16 | Partners' Capital + | 1,277 | 998 | 807 | 655 | -399 | -462 | -789 | -1,145 | -1,372 | 23 | 46 |
| 17 | Limited Liability Company (LLC) Members' Equity + | 1,072 | 687 | 583 | 701 | -969 | -573 | -848 | -1,145 | -1,364 | 23 | 46 |
| 18 | Limited Liability Company (LLC) Members' Equity + | 1,072 | 687 | 583 | 701 | -969 | -573 | -848 | -1,145 | -1,364 | 23 | 46 |
| 19 | Current Assets + | 5,090 | 4,126 | 3,874 | 3,450 | 3,337 | 2,412 | 2,146 | 1,946 | 1,510 | 0 | 0 |
| 20 | Cash + | 88 | 62 | 47 | 46 | 40 | 2 | 3 | 3 | 3 | 0 | 0 |
| 21 | Current Receivables + | 2,410 | 2,582 | 2,394 | 1,993 | 1,707 | 1,166 | 975 | 924 | 745 | 0 | 0 |
| 22 | Current Prepaid Expense + | 159 | 138 | 151 | 146 | 123 | 51 | 45 | 43 | 33 | 0 | 0 |
| 23 | Long-Term Other Undisclosed Assets | 0 | 0 | 0 | 0 | 0 | 0 | 0 | 0 | 0 | 1,529 | 0 |
| 24 | Long-Term Assets + | 13,239 | 12,774 | 11,800 | 11,850 | 10,727 | 720 | 464 | 410 | 302 | 1,807 | 0 |
| 25 | Long-term Investments and Receivables + | 0 | 0 | 41 | 8 | 13 | 33 | 35 | 40 | 36 | 0 | 0 |
| 26 | Current Liabilities + | 4,558 | 3,945 | 3,534 | 2,904 | 2,705 | 1,594 | 1,472 | 1,482 | 1,309 | 0 | 0 |
| 27 | Long-Term Other Undisclosed Liabilities | 12,262 | 0 | 109 | 98 | 89 | 66 | 62 | 37 | 12 | 0 | 0 |
| 28 | Long-Term Liabilities + | 13,726 | 13,043 | 12,061 | 11,480 | 9,643 | 2,668 | 2,538 | 2,252 | 2,549 | 0 | 0 |
| 29 | Increase (Decrease) in Stockholders' Equity [Roll Forward] + | 6,166 | 5,733 | 4,770 | -3,374 | -1,000 | 0 | 0 | 0 | 0 | 0 | 0 |
| 30 | Treasury Stock Transactions + | 6,166 | 5,733 | 4,770 | -3,374 | -1,000 | 0 | 0 | 0 | 0 | 0 | 0 |
| 31 | Treasury Stock + | 6,166 | 5,733 | 4,770 | -3,374 | -1,000 | 0 | 0 | 0 | 0 | 0 | 0 |
| 32 | Current Other Assets + | 0 | 0 | 322 | 259 | 235 | 83 | 92 | 90 | 74 | 0 | 0 |
| 33 | Total Current Assets + | 5,090 | 4,126 | 3,874 | 3,450 | 3,337 | 2,412 | 2,146 | 1,946 | 1,510 | 0 | 0 |
| 34 | Operating Lease + | 471 | 496 | 0 | 0 | 0 | 0 | 0 | 0 | 0 | 0 | 0 |
| 35 | Goodwill + | 12,654 | 12,159 | 11,800 | 11,850 | 10,727 | 720 | 464 | 410 | 302 | 278 | 0 |
| 36 | Long-Term Regulated Entity + | 0 | 0 | 0 | 0 | 7 | 9 | 10 | 2 | 631 | 0 | 0 |
| 37 | Deferred Income Tax Assets + | 114 | 119 | 0 | 0 | 0 | 0 | 0 | 0 | 0 | 0 | 0 |
| 38 | Total Assets + | 24,564 | 23,251 | 22,549 | 22,742 | 21,208 | 3,926 | 3,306 | 3,067 | 2,499 | 2,323 | 0 |
| 39 | Total Liabilities + | 18,284 | 16,988 | 15,595 | 14,384 | 12,348 | 4,262 | 4,010 | 3,734 | 3,858 | 0 | 0 |
| 40 | Stockholders' Equity Attributable to Noncontrolling Interest + | 279 | 260 | 240 | 249 | 227 | 228 | 0 | 0 | 0 | 0 | 0 |
| 41 | Total Stockholders' Equity + | 6,280 | 6,263 | 6,954 | 8,244 | 8,860 | -336 | -704 | -667 | -1,359 | -970 | -900 |
| 42 | Total Liabilities and Equity + | 24,564 | 23,251 | 22,549 | 22,742 | 21,208 | 3,926 | 3,306 | 3,067 | 2,499 | 0 | 0 |
Year | 2020 | 2019 | 2018 | 2017 | 2016 | 2015 | 2014 | 2013 | 2012 | 2011 | |
|---|---|---|---|---|---|---|---|---|---|---|---|
| 1 | 0 | 0 | 0 | 9,739 | 6,878 | 5,737 | 5,460 | 5,100 | 4,866 | 4,328 | |
| 2 | 0 | 0 | 0 | 0 | 0 | 3 | 6 | 5 | 10 | 10 | |
| 3 | 0 | 0 | 0 | 0 | 36 | 0 | 0 | 0 | 0 | 0 | |
| 4 | 0 | 0 | 0 | 0 | 0 | 0 | 0 | 0 | 0 | 1 | |
| 5 | 0 | 0 | 0 | 0 | 87 | 0 | 0 | 0 | 0 | 0 | |
| 6 | 0 | 0 | 0 | 0 | 0 | 0 | 2 | 3 | 4 | 5 | |
| 7 | 1,789 | 1,734 | 1,716 | 1,605 | 1,011 | 815 | 882 | 861 | 818 | 762 | |
| 8 | 0 | -1 | 0 | 1 | 1 | 1 | 1 | 1 | 1 | 1 | |
| 9 | 731 | 777 | 741 | 719 | 642 | 646 | 590 | 462 | 396 | 345 | |
| 10 | 0 | 0 | 0 | 0 | 0 | 0 | 5 | 0 | 0 | 0 | |
| 11 | 0 | 0 | 0 | 0 | 0 | 0 | 0 | 0 | -1 | 0 | |
| 12 | 6 | 9 | 8 | 7 | 4 | 4 | 3 | 4 | 3 | 4 | |
| 13 | 65 | 37 | -5 | -30 | 8 | -2 | 9 | 0 | 4 | -9 | |
| 14 | 416 | 447 | 414 | 346 | 144 | 101 | -101 | 124 | 134 | 109 | |
| 15 | 13 | 24 | 2 | 19 | 31 | 8 | 0 | 20 | 1 | 46 | |
| 16 | 373 | 352 | 328 | 331 | 479 | 539 | 502 | 323 | 267 | 185 | |
| 17 | 7 | -9 | 15 | 10 | -4 | 8 | 4 | -1 | 3 | 71 | |
| 18 | -72 | -116 | -59 | 987 | -345 | -159 | -150 | -96 | -93 | -15 | |
| 19 | 308 | 227 | 284 | 1,328 | 130 | 388 | 357 | 226 | 177 | 240 | |
| 20 | -29 | -36 | -25 | -19 | -15 | -1 | 0 | -1 | -1 | -1 | |
| 21 | Total Net Income (Loss) Attributable to Parent + | 279 | 191 | 259 | 1,309 | 115 | 387 | 356 | 227 | 178 | 242 |
| 22 | Total Earnings Per Share + | 1.46 | 0.98 | 1.27 | 6.01 | 0.77 | 3.15 | 2.78 | 1.83 | 1.53 | 2.08 |
| 23 | Total Earnings Per Share + | 1.43 | 0.96 | 1.24 | 5.88 | 0.76 | 3.08 | 2.72 | 1.77 | 1.51 | 2.05 |
 Click to Enlarge