| Date | Price $ | Result % | Candle Name | Side |
|---|---|---|---|---|
| 001 24 Apr 2024 | Sell Price: 106.89 | Profit: Open Day1 ($ 106.65) | Abandoned Baby | Sell |
| 002 26 Mar 2024 | Buy Price: 111.50 | Profit: Open Day1 ($ 112.00) | Abandoned Baby | Buy |
| 003 29 Feb 2024 | Sell Price: 118.64 | Profit: Open Day1 ($ 118.57) | Engulfing | Sell |
| 004 27 Feb 2024 | Buy Price: 119.40 | Profit: Open Day1 ($ 119.49) | Piercing Line | Buy |
| 005 26 Feb 2024 | Sell Price: 118.69 | Profit: Open Day1 ($ 118.16) | Engulfing | Sell |
| 006 12 Feb 2024 | Buy Price: 112.53 | Loss: Close Day2 ($ 112.02) | Engulfing | Buy |
| 007 20 Dec 2023 | Sell Price: 107.40 | Loss: Close Day2 ($ 109.03) | Abandoned Baby | Sell |
| 008 26 Oct 2023 | Buy Price: 93.98 | Profit: Open Day1 ($ 94.75) | Piercing Line | Buy |
| 009 04 Oct 2023 | Sell Price: 95.05 | Loss: Close Day2 ($ 96.86) | Engulfing | Sell |
| 010 04 Oct 2023 | Sell Price: 95.65 | Loss: Close Day2 ($ 96.86) | Dark Cloud Cover | Sell |
| 011 03 Oct 2023 | Buy Price: 95.69 | Profit: Open Day1 ($ 95.89) | Abandoned Baby | Buy |
| 012 03 Oct 2023 | Buy Price: 95.79 | Profit: Open Day1 ($ 95.89) | Engulfing | Buy |
| 013 15 Aug 2023 | Sell Price: 104.94 | Profit: Open Day1 ($ 104.46) | Engulfing | Sell |
| 014 08 Aug 2023 | Sell Price: 105.58 | Profit: Open Day1 ($ 105.50) | Abandoned Baby | Sell |
| 015 04 Aug 2023 | Buy Price: 107.65 | Profit: Open Day1 ($ 107.99) | Piercing Line | Buy |
| 016 19 Jul 2023 | Buy Price: 107.28 | Profit: Open Day1 ($ 108.10) | Abandoned Baby | Buy |
| 017 27 Jun 2023 | Sell Price: 107.79 | Profit: Close Day1 ($ 107.61) | Engulfing | Sell |
| 018 04 May 2023 | Sell Price: 110.86 | Profit: Open Day2 ($ 110.46) | Abandoned Baby | Sell |
| 019One Year Average | Both Sides Result for 18 Signals |
Loss: $ -0.36 ($ -0.02 / Signal) |
All of Them | Buy + Sell |
| Simple Moving Averages (SMA) Period | Value $ | Signal | Exponential Moving Averages (EMA) Period | Value $ | Signal | |
|---|---|---|---|---|---|---|
| 2 | 107.19 | BUY | 2 | 107.32 | BUY | |
| 3 | 107.09 | BUY | 3 | 107.25 | BUY | |
| 5 | 107.18 | BUY | 5 | 107.25 | BUY | |
| 8 | 106.80 | BUY | 8 | 107.48 | BUY | |
| 13 | 108.02 | SELL | 13 | 108.11 | SELL | |
| 21 | 109.41 | SELL | 21 | 109.20 | SELL | |
| 34 | 111.39 | SELL | 34 | 110.50 | SELL | |
| 55 | 113.51 | SELL | 55 | 111.25 | SELL | |
| 90 | 112.86 | SELL | 90 | 110.79 | SELL | |
| 200 | 106.69 | BUY | 200 | 108.70 | SELL |
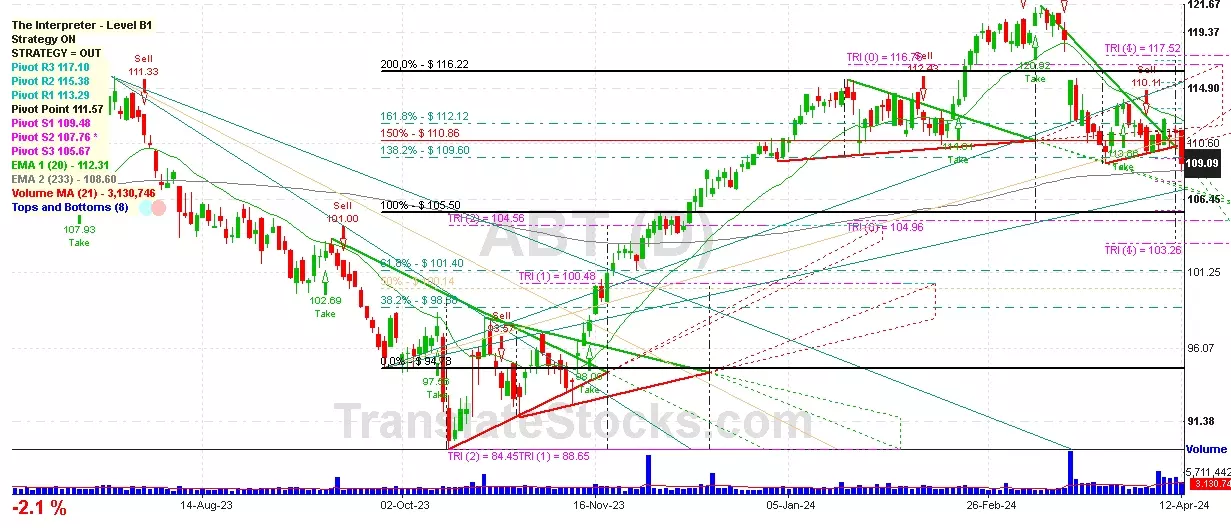
Abbott Laboratories
IPO: 1937-03-01
Ticker: ABTIndices: S&P 500,
Exchange: New York Stock Exchange, Inc. (US - USD)
Website: https://www.abbott.com/
Phone:
Common Stock
Life Sciences (
Pharmaceutical Preparations
Year | 2020 | 2019 | 2018 | 2017 | 2016 | 2015 | 2014 | 2013 | 2012 | 2011 | 2010 | 2009 | 2008 | 2007 | 2006 | |
|---|---|---|---|---|---|---|---|---|---|---|---|---|---|---|---|---|
| 1 | Assets + | 72,548 | 67,887 | 67,173 | 76,250 | 52,666 | 41,247 | 41,275 | 42,953 | 67,235 | 60,277 | 59,462 | 52,417 | 42,419 | 39,714 | 521 |
| 2 | Current Assets + | 20,441 | 15,667 | 14,632 | 20,147 | 26,776 | 14,155 | 15,261 | 19,247 | 31,323 | 23,769 | 22,318 | 23,314 | 17,043 | 14,043 | 521 |
| 3 | Cash + | 7,148 | 4,140 | 4,086 | 9,610 | 18,775 | 6,125 | 4,460 | 8,098 | 15,174 | 8,098 | 7,626 | 11,065 | 6,153 | 2,820 | 521 |
| 4 | Current Receivables + | 6,414 | 5,425 | 5,182 | 5,249 | 3,248 | 3,418 | 3,586 | 3,986 | 7,613 | 7,684 | 7,184 | 6,542 | 5,466 | 4,947 | 0 |
| 5 | Inventory + | 5,012 | 4,316 | 3,796 | 3,601 | 2,434 | 2,599 | 2,643 | 2,693 | 3,792 | 3,284 | 3,189 | 3,265 | 2,776 | 2,951 | 0 |
| 6 | Current Other Assets + | 0 | 0 | 0 | 1,667 | 1,806 | 1,908 | 1,975 | 1,504 | 1,757 | 2,003 | 1,545 | 1,211 | 1,259 | 1,214 | 0 |
| 7 | Current Disposal Group + | 0 | 0 | 9 | 20 | 513 | 105 | 892 | 438 | 0 | 0 | 0 | 0 | 0 | 0 | 0 |
| 8 | Total Current Assets + | 20,441 | 15,667 | 14,632 | 20,147 | 26,776 | 14,155 | 15,261 | 19,247 | 31,323 | 23,769 | 22,318 | 23,314 | 17,043 | 14,043 | 0 |
| 9 | Long-Term Other Undisclosed Assets | 2,541 | 2,055 | 1,766 | 1,825 | -607 | -23 | 0 | 0 | 0 | 0 | 0 | 0 | 0 | 1 | 0 |
| 10 | Long-Term Assets + | 52,107 | 52,220 | 52,541 | 56,103 | 25,890 | 27,092 | 26,014 | 23,705 | 35,912 | 36,508 | 37,092 | 29,103 | 25,377 | 25,671 | 0 |
| 11 | Operating Lease + | 1,101 | 934 | 0 | 0 | 0 | 0 | 0 | 0 | 0 | 0 | 0 | 0 | 0 | 0 | 0 |
| 12 | Property + | 9,029 | 8,038 | 7,563 | 7,607 | 5,705 | 5,730 | 5,935 | 5,905 | 8,063 | 7,874 | 7,971 | 7,619 | 7,219 | 7,518 | 0 |
| 13 | Long-term Investments and Receivables + | 821 | 883 | 897 | 883 | 2,947 | 4,041 | 229 | 119 | 274 | 378 | 302 | 1,133 | 1,074 | 1,125 | 0 |
| 14 | Goodwill + | 23,744 | 23,195 | 23,254 | 24,020 | 7,683 | 9,638 | 10,067 | 9,772 | 15,774 | 15,705 | 15,930 | 13,200 | 9,987 | 10,129 | 0 |
| 15 | Intangible Assets + | 14,784 | 17,025 | 18,942 | 21,473 | 4,539 | 5,562 | 6,198 | 5,735 | 8,588 | 9,990 | 12,152 | 6,292 | 5,151 | 5,720 | 0 |
| 16 | Long-Term Other Assets + | 0 | 0 | 0 | 0 | 0 | 2,119 | 1,651 | 2,109 | 3,213 | 2,561 | 790 | 858 | 1,945 | 1,178 | 0 |
| 17 | Long-Term Regulated Entity + | 87 | 90 | 102 | 119 | 117 | 21 | 0 | 0 | 0 | 0 | 0 | 0 | 0 | 0 | 0 |
| 18 | Long-Term Disposal Group + | 0 | 0 | 17 | 176 | 5,506 | 4 | 2,738 | 66 | 0 | 0 | 0 | 0 | 0 | 0 | 0 |
| 19 | Total Long-Term Assets + | 0 | 0 | 0 | 0 | 0 | 0 | 26,014 | 23,705 | 35,912 | 36,508 | 37,092 | 29,103 | 25,377 | 0 | 0 |
| 20 | Total Assets + | 72,548 | 67,887 | 67,173 | 76,250 | 52,666 | 41,247 | 41,275 | 42,953 | 67,235 | 60,277 | 59,462 | 52,417 | 42,419 | 39,714 | 0 |
| 21 | Liabilities and Equity + | 72,548 | 67,887 | 67,173 | 76,250 | 52,666 | 41,247 | 41,275 | 42,953 | 67,235 | 60,277 | 59,462 | 52,417 | 42,419 | 39,714 | 14,054 |
| 22 | Liabilities + | 11,907 | 10,863 | 9,012 | 8,912 | 6,660 | 9,186 | 10,532 | 9,507 | 13,280 | 15,480 | 17,262 | 13,049 | 11,592 | 9,103 | 0 |
| 23 | Current Liabilities + | 11,907 | 10,863 | 9,012 | 8,912 | 6,660 | 9,186 | 10,532 | 9,507 | 13,280 | 15,480 | 17,262 | 13,049 | 11,592 | 9,103 | 0 |
| 24 | Long-Term Liabilities + | 19,429 | 17,416 | 21,399 | 36,240 | 25,419 | 10,883 | 9,104 | 8,179 | 27,141 | 20,271 | 19,724 | 16,468 | 13,308 | 12,787 | 0 |
| 25 | Stockholders' Equity + | 33,003 | 31,301 | 30,722 | 31,098 | 20,717 | 21,326 | 21,639 | 25,267 | 26,813 | 24,526 | 22,476 | 22,899 | 17,519 | 17,824 | 14,054 |
| 26 | Stockholders' Equity Attributable to Parent + | 32,784 | 31,088 | 30,524 | 30,897 | 20,538 | 21,211 | 21,526 | 25,171 | 26,721 | 24,440 | 22,388 | 22,856 | 17,480 | 17,779 | 0 |
| 27 | Stockholders' Equity Attributable to Noncontrolling Interest + | 219 | 213 | 198 | 201 | 179 | 115 | 113 | 96 | 92 | 86 | 88 | 43 | 39 | 45 | 0 |
| 28 | Total Stockholders' Equity + | 33,003 | 31,301 | 30,722 | 31,098 | 20,717 | 21,326 | 21,639 | 25,267 | 26,813 | 24,526 | 22,476 | 22,899 | 17,519 | 17,824 | 14,054 |
| 29 | Stockholders' Equity + | 1 | 1 | 1 | 1 | 1 | 1 | 1 | 1 | 11,756 | 9,818 | 8,746 | 8,259 | 1 | 1 | 0 |
| 30 | Preferred Stock + | 1 | 1 | 1 | 1 | 1 | 1 | 1 | 1 | 1 | 1 | 1 | 1 | 1 | 1 | 0 |
| 31 | Common Stock + | 0 | 0 | 0 | 0 | 0 | 0 | 0 | 0 | 11,755 | 9,817 | 8,745 | 8,258 | 0 | 0 | 0 |
| 32 | Partners' Capital + | 27,627 | 25,847 | 24,560 | 23,978 | 25,565 | 25,757 | 22,874 | 21,979 | 24,151 | 20,907 | 18,927 | 17,054 | 13,825 | 10,806 | 0 |
| 33 | Partners' Capital + | 27,627 | 25,847 | 24,560 | 23,978 | 25,565 | 25,757 | 22,874 | 21,979 | 24,151 | 20,907 | 18,927 | 17,054 | 13,825 | 10,806 | 0 |
| 34 | Limited Liability Company (LLC) Members' Equity + | 18,681 | 17,382 | 16,974 | 17,916 | 18,302 | 19,099 | 17,821 | 19,967 | 20,557 | 18,310 | 17,560 | 17,908 | 12,661 | 12,888 | 0 |
| 35 | Limited Liability Company (LLC) Members' Equity + | 18,681 | 17,382 | 16,974 | 17,916 | 18,302 | 19,099 | 17,821 | 19,967 | 20,557 | 18,310 | 17,560 | 17,908 | 12,661 | 12,888 | 0 |
| 36 | Total Liabilities and Equity + | 72,548 | 67,887 | 67,173 | 76,250 | 52,666 | 41,247 | 41,275 | 42,953 | 67,235 | 60,277 | 59,462 | 52,417 | 42,419 | 39,714 | 0 |

 Click to Enlarge