| Date | Price $ | Result % | Candle Name | Side |
|---|---|---|---|---|
| 001 11 Apr 2024 | Buy Price: 68.84 | Loss: Close Day2 ($ 67.43) | Abandoned Baby | Buy |
| 002 05 Mar 2024 | Sell Price: 67.02 | Loss: Close Day2 ($ 67.83) | Engulfing | Sell |
| 003 28 Feb 2024 | Buy Price: 66.99 | Profit: Close Day2 ($ 67.13) | Abandoned Baby | Buy |
| 004 26 Feb 2024 | Sell Price: 66.67 | Profit: Open Day1 ($ 66.26) | Engulfing | Sell |
| 005 14 Feb 2024 | Buy Price: 65.95 | Profit: Open Day1 ($ 66.12) | Abandoned Baby | Buy |
| 006 15 Nov 2023 | Sell Price: 53.85 | Loss: Close Day2 ($ 54.34) | Abandoned Baby | Sell |
| 007 18 Sep 2023 | Buy Price: 53.00 | Profit: Open Day1 ($ 53.01) | Engulfing | Buy |
| 008 08 Sep 2023 | Sell Price: 53.87 | Profit: Close Day2 ($ 53.43) | Abandoned Baby | Sell |
| 009 09 Aug 2023 | Buy Price: 51.06 | Profit: Open Day1 ($ 51.10) | Abandoned Baby | Buy |
| 010 18 Jul 2023 | Buy Price: 52.81 | Profit: Open Day1 ($ 52.98) | Piercing Line | Buy |
| 011 20 Jun 2023 | Sell Price: 54.04 | Profit: Open Day1 ($ 53.94) | Abandoned Baby | Sell |
| 012One Year Average | Both Sides Result for 11 Signals |
Loss: $ -1.23 ($ -0.11 / Signal) |
All of Them | Buy + Sell |
| Simple Moving Averages (SMA) Period | Value $ | Signal | Exponential Moving Averages (EMA) Period | Value $ | Signal | |
|---|---|---|---|---|---|---|
| 2 | 73.11 | BUY | 2 | 72.68 | BUY | |
| 3 | 71.73 | BUY | 3 | 71.96 | BUY | |
| 5 | 70.11 | BUY | 5 | 70.93 | BUY | |
| 8 | 69.26 | BUY | 8 | 70.09 | BUY | |
| 13 | 68.90 | BUY | 13 | 69.40 | BUY | |
| 21 | 68.64 | BUY | 21 | 68.83 | BUY | |
| 34 | 68.08 | BUY | 34 | 68.09 | BUY | |
| 55 | 67.40 | BUY | 55 | 66.77 | BUY | |
| 90 | 64.29 | BUY | 90 | 64.59 | BUY | |
| 200 | 57.88 | BUY | 200 | 59.67 | BUY |
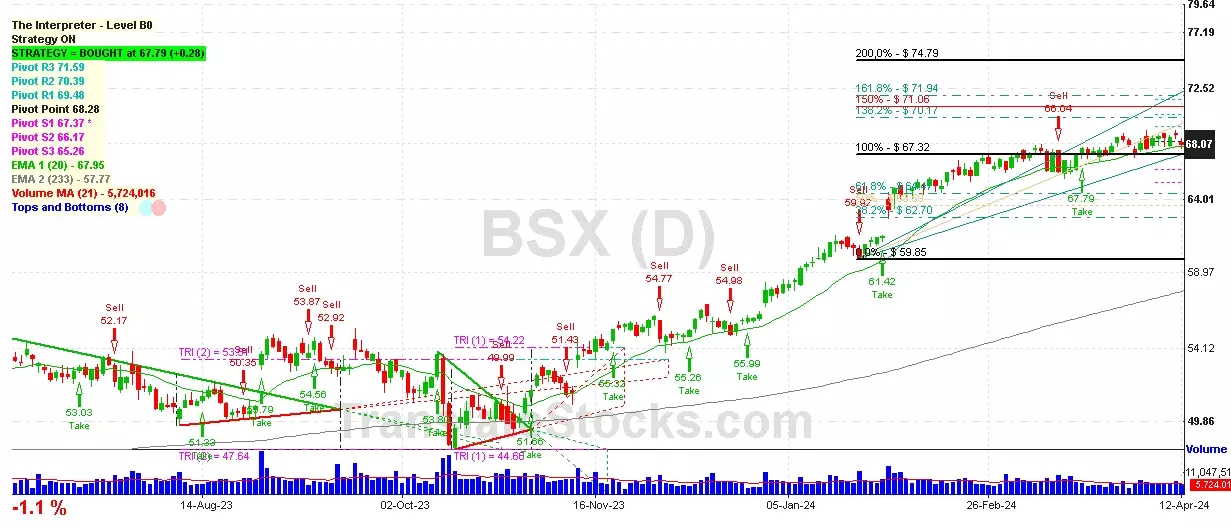
Boston Scientific Corp
IPO: 1992-05-19
Ticker: BSXIndices: S&P 500,
Exchange: New York Stock Exchange, Inc. (US - USD)
Website: https://www.bostonscientific.com/
Phone:
Common Stock
Life Sciences (
Surgical & Medical Instruments & Apparatus

 Click to Enlarge