| Date | Price $ | Result % | Candle Name | Side |
|---|---|---|---|---|
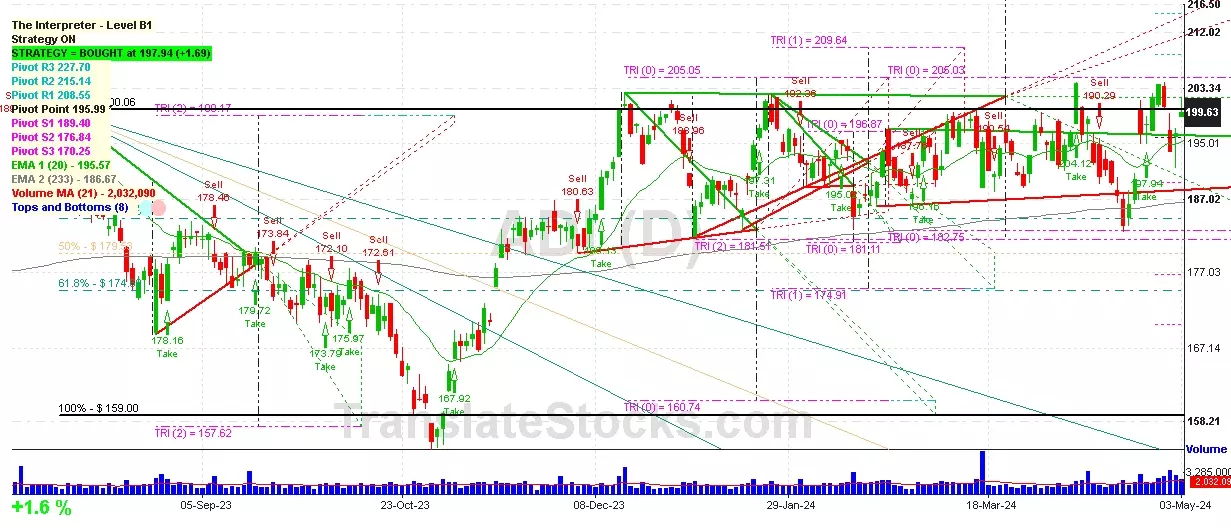
| 001 29 Feb 2024 | Buy Price: 191.82 | Profit: Open Day1 ($ 192.55) | Abandoned Baby | Buy |
| 002 12 Feb 2024 | Sell Price: 194.05 | Profit: Open Day1 ($ 188.16) | Abandoned Baby | Sell |
| 003 02 Feb 2024 | Buy Price: 192.26 | Profit: Open Day1 ($ 192.79) | Engulfing | Buy |
| 004 02 Feb 2024 | Buy Price: 192.10 | Profit: Open Day1 ($ 192.79) | Piercing Line | Buy |
| 005 12 Jan 2024 | Sell Price: 188.36 | Profit: Open Day1 ($ 187.85) | Engulfing | Sell |
| 006 05 Sep 2023 | Sell Price: 181.54 | Profit: Open Day2 ($ 179.94) | Abandoned Baby | Sell |
| 007 22 Jun 2023 | Buy Price: 186.11 | Profit: Open Day2 ($ 187.85) | Engulfing | Buy |
| 008One Year Average | Both Sides Result for 7 Signals |
Profit: $ 11.69 ($ 1.67 / Signal) |
All of Them | Buy + Sell |
| Simple Moving Averages (SMA) Period | Value $ | Signal | Exponential Moving Averages (EMA) Period | Value $ | Signal | |
|---|---|---|---|---|---|---|
| 2 | 198.06 | BUY | 2 | 198.57 | BUY | |
| 3 | 196.67 | BUY | 3 | 198.29 | BUY | |
| 5 | 198.90 | BUY | 5 | 198.01 | BUY | |
| 8 | 198.87 | BUY | 8 | 197.33 | BUY | |
| 13 | 194.43 | BUY | 13 | 196.35 | BUY | |
| 21 | 194.85 | BUY | 21 | 195.49 | BUY | |
| 34 | 194.30 | BUY | 34 | 194.78 | BUY | |
| 55 | 193.76 | BUY | 55 | 193.85 | BUY | |
| 90 | 193.29 | BUY | 90 | 192.16 | BUY | |
| 200 | 185.77 | BUY | 200 | 187.70 | BUY |
Analog Devices Inc
IPO: 1979-04-03
Ticker: ADIIndices: S&P 500,
Nasdaq 100,
Exchange: Nasdaq Nms - Global Market (US - USD)
Website: http://www.analog.com/
Phone:
Common Stock
Manufacturing (
Semiconductors & Related Devices

 Click to Enlarge