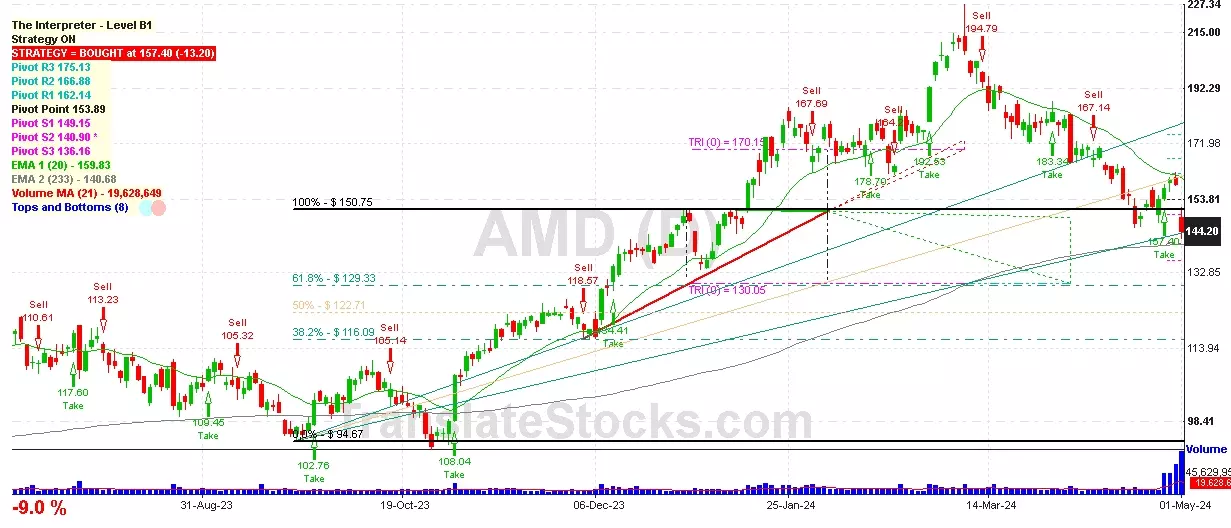
Hey Friend, I'm analysing ADVANCED MICRO DEVICES (AMD), and it is between the Support of $ 140.90 (PivotS2) and the Resistance of $ 149.15 (PivotS1). The stock is also approaching the line of PivotS2 at $ 140.90, and if it goes below this line it could reach the next Support of Triangle projection at $130.05.

| Date | Price $ | Result % | Candle Name | Side |
|---|---|---|---|---|
| 001 17 Apr 2024 | Sell Price: 154.02 | Profit: Open Day2 ($ 151.59) | Engulfing | Sell |
| 002 15 Mar 2024 | Buy Price: 191.06 | Profit: Open Day1 ($ 193.29) | Piercing Line | Buy |
| 003 05 Mar 2024 | Sell Price: 205.13 | Loss: Close Day2 ($ 211.38) | Abandoned Baby | Sell |
| 004 09 Nov 2023 | Sell Price: 113.49 | Loss: Close Day2 ($ 116.79) | Engulfing | Sell |
| 005 23 Aug 2023 | Buy Price: 109.43 | Profit: Open Day1 ($ 111.06) | Engulfing | Buy |
| 006 12 Jul 2023 | Buy Price: 114.58 | Profit: Open Day1 ($ 115.76) | Abandoned Baby | Buy |
| 007 12 May 2023 | Sell Price: 95.26 | Profit: Open Day1 ($ 95.20) | Abandoned Baby | Sell |
| 008 04 May 2023 | Buy Price: 86.61 | Profit: Close Day1 ($ 89.84) | Engulfing | Buy |
| 009One Year Average | Both Sides Result for 8 Signals |
Profit: $ 1.21 ($ 0.15 / Signal) |
All of Them | Buy + Sell |
| Simple Moving Averages (SMA) Period | Value $ | Signal | Exponential Moving Averages (EMA) Period | Value $ | Signal | |
|---|---|---|---|---|---|---|
| 2 | 151.29 | SELL | 2 | 148.97 | SELL | |
| 3 | 154.26 | SELL | 3 | 151.10 | SELL | |
| 5 | 154.79 | SELL | 5 | 152.73 | SELL | |
| 8 | 153.32 | SELL | 8 | 153.93 | SELL | |
| 13 | 154.32 | SELL | 13 | 156.24 | SELL | |
| 21 | 160.23 | SELL | 21 | 160.31 | SELL | |
| 34 | 168.58 | SELL | 34 | 164.93 | SELL | |
| 55 | 176.04 | SELL | 55 | 166.72 | SELL | |
| 90 | 169.50 | SELL | 90 | 162.65 | SELL | |
| 200 | 137.54 | BUY | 200 | 144.70 | SELL |
Advanced Micro Devices
IPO: 1979-10-15
Ticker: AMDIndices: S&P 500,
Nasdaq 100,
Exchange: Nasdaq Nms - Global Market (US - USD)
Website: https://www.amd.com/en
Phone:
Common Stock
Manufacturing (
Semiconductors & Related Devices
 Click to Enlarge