| Date | Price $ | Result % | Candle Name | Side |
|---|---|---|---|---|
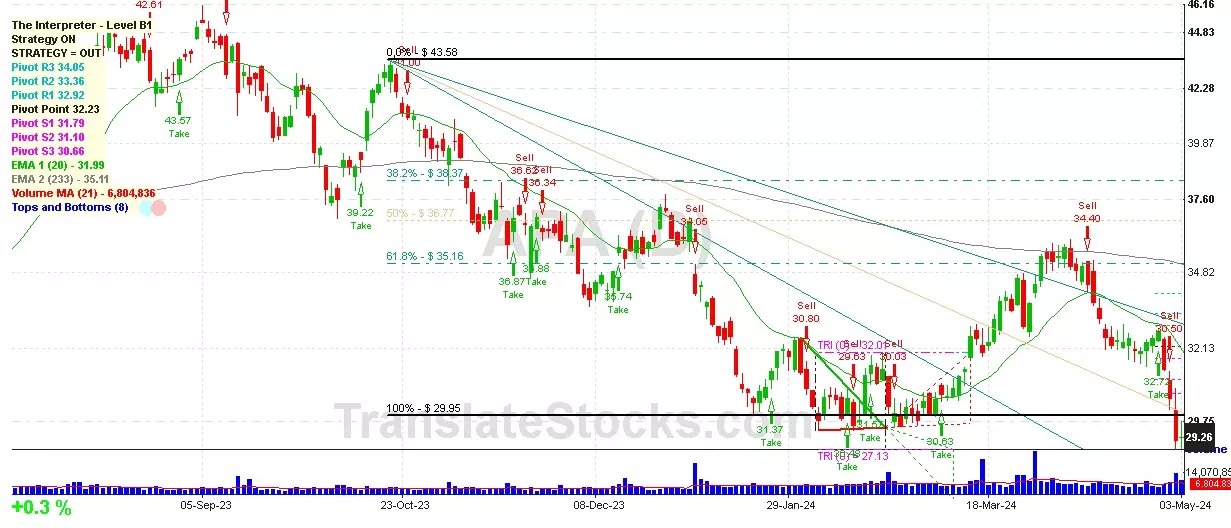
| 001 26 Mar 2024 | Sell Price: 32.88 | Profit: Open Day1 ($ 32.73) | Engulfing | Sell |
| 002 07 Mar 2024 | Sell Price: 30.55 | Loss: Close Day2 ($ 31.20) | Abandoned Baby | Sell |
| 003 04 Mar 2024 | Sell Price: 30.03 | Loss: Close Day2 ($ 30.63) | Engulfing | Sell |
| 004 29 Jan 2024 | Sell Price: 31.87 | Profit: Open Day1 ($ 31.45) | Abandoned Baby | Sell |
| 005One Year Average | Both Sides Result for 4 Signals |
Loss: $ -0.68 ($ -0.17 / Signal) |
All of Them | Buy + Sell |
| Simple Moving Averages (SMA) Period | Value $ | Signal | Exponential Moving Averages (EMA) Period | Value $ | Signal | |
|---|---|---|---|---|---|---|
| 2 | 29.22 | BUY | 2 | 29.43 | SELL | |
| 3 | 29.65 | SELL | 3 | 29.74 | SELL | |
| 5 | 30.62 | SELL | 5 | 30.28 | SELL | |
| 8 | 31.25 | SELL | 8 | 30.85 | SELL | |
| 13 | 31.66 | SELL | 13 | 31.49 | SELL | |
| 21 | 32.67 | SELL | 21 | 32.04 | SELL | |
| 34 | 33.23 | SELL | 34 | 32.35 | SELL | |
| 55 | 32.31 | SELL | 55 | 32.56 | SELL | |
| 90 | 32.30 | SELL | 90 | 33.11 | SELL | |
| 200 | 36.49 | SELL | 200 | 34.82 | SELL |
Apa Corp
IPO: 1969-05-27
Ticker: APAIndices: S&P 500,
Exchange: Nasdaq Nms - Global Market (US - USD)
Common Stock
Energy & Transportation (
Crude Petroleum & Natural Gas

 Click to Enlarge