| Date | Price $ | Result % | Candle Name | Side |
|---|---|---|---|---|
| 001 05 Mar 2024 | Sell Price: 1,342.75 | Loss: Close Day2 ($ 1,407.01) | Abandoned Baby | Sell |
| 002 18 Jan 2024 | Buy Price: 1,143.91 | Profit: Open Day1 ($ 1,157.31) | Abandoned Baby | Buy |
| 003 17 Jan 2024 | Sell Price: 1,103.67 | Loss: Close Day2 ($ 1,211.20) | Abandoned Baby | Sell |
| 004 27 Dec 2023 | Sell Price: 1,126.05 | Profit: Close Day1 ($ 1,122.41) | Engulfing | Sell |
| 005 27 Dec 2023 | Sell Price: 1,126.17 | Profit: Close Day1 ($ 1,122.41) | Dark Cloud Cover | Sell |
| 006 06 Sep 2023 | Buy Price: 872.27 | Loss: Close Day2 ($ 857.55) | Abandoned Baby | Buy |
| 007 24 Aug 2023 | Sell Price: 855.25 | Profit: Close Day1 ($ 851.82) | Engulfing | Sell |
| 008 24 Aug 2023 | Sell Price: 854.46 | Profit: Close Day1 ($ 851.82) | Dark Cloud Cover | Sell |
| 009 17 Jul 2023 | Buy Price: 910.35 | Loss: Close Day2 ($ 901.37) | Abandoned Baby | Buy |
| 010 05 Jul 2023 | Sell Price: 861.86 | Profit: Open Day1 ($ 845.00) | Abandoned Baby | Sell |
| 011One Year Average | Both Sides Result for 10 Signals |
Loss: $ -151.76 ($ -15.18 / Signal) |
All of Them | Buy + Sell |
| Simple Moving Averages (SMA) Period | Value $ | Signal | Exponential Moving Averages (EMA) Period | Value $ | Signal | |
|---|---|---|---|---|---|---|
| 2 | 1,271.57 | SELL | 2 | 1,265.67 | SELL | |
| 3 | 1,293.92 | SELL | 3 | 1,277.31 | SELL | |
| 5 | 1,304.05 | SELL | 5 | 1,284.53 | SELL | |
| 8 | 1,281.34 | SELL | 8 | 1,286.62 | SELL | |
| 13 | 1,279.75 | SELL | 13 | 1,290.11 | SELL | |
| 21 | 1,303.62 | SELL | 21 | 1,295.04 | SELL | |
| 34 | 1,304.20 | SELL | 34 | 1,294.95 | SELL | |
| 55 | 1,303.10 | SELL | 55 | 1,277.81 | SELL | |
| 90 | 1,248.78 | SELL | 90 | 1,230.90 | BUY | |
| 200 | 1,055.67 | BUY | 200 | 1,087.69 | BUY |
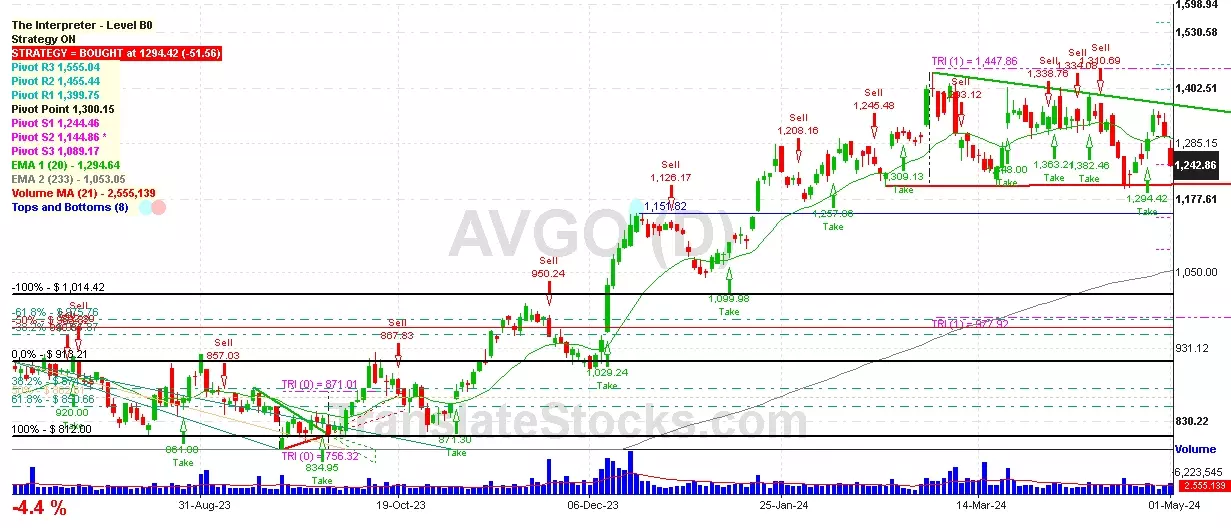
Broadcom Inc
IPO: 2016-02-01
Ticker: AVGOIndices: S&P 500,
Nasdaq 100,
Exchange: Nasdaq Nms - Global Market (US - USD)
Website: https://www.broadcom.com
Phone:
Common Stock
Manufacturing (
Semiconductors & Related Devices

 Click to Enlarge