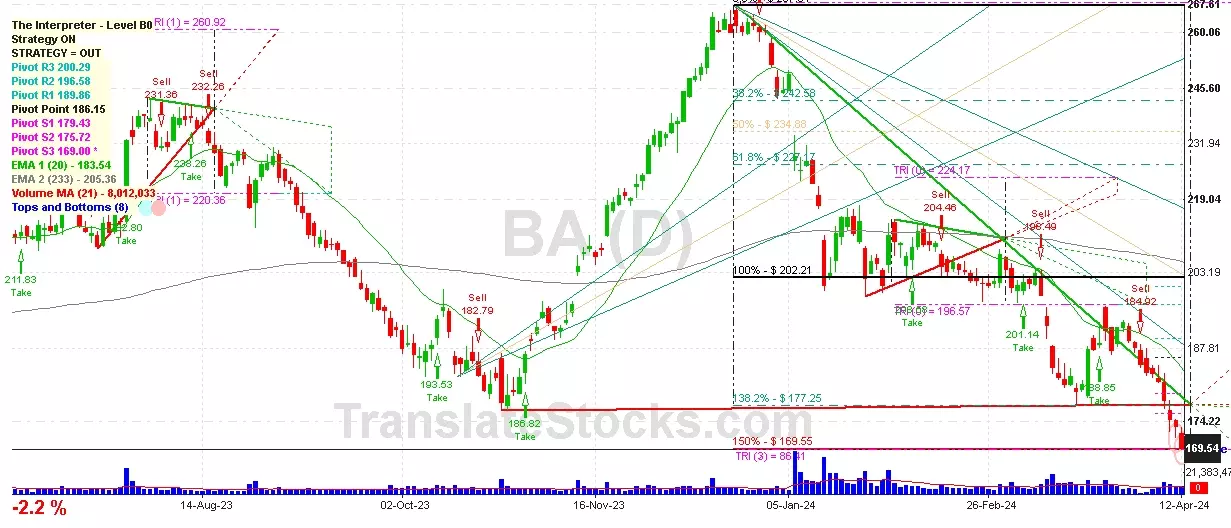
Hey Friend, I'm analysing BOEING CO/THE (BA), and it is between the Support of $ 169.00 (PivotS3) and the Resistance of $ 169.55 (150% of Fibonacci). The stock is also approaching the line of PivotS3 at $ 169.00, and if it goes below this line it could reach the next Support of 200% of Fibonacci at $ 136.88.

| Date | Price $ | Result % | Candle Name | Side |
|---|---|---|---|---|
| 001 15 Mar 2024 | Buy Price: 182.53 | Loss: Close Day2 ($ 181.12) | Engulfing | Buy |
| 002 24 Jan 2024 | Buy Price: 214.13 | Loss: Close Day2 ($ 205.50) | Piercing Line | Buy |
| 003 26 Dec 2023 | Buy Price: 262.79 | Loss: Close Day2 ($ 260.36) | Engulfing | Buy |
| 004 27 Nov 2023 | Sell Price: 219.30 | Loss: Close Day2 ($ 224.43) | Abandoned Baby | Sell |
| 005 12 Oct 2023 | Sell Price: 191.30 | Profit: Open Day1 ($ 186.27) | Abandoned Baby | Sell |
| 006 25 Sep 2023 | Buy Price: 198.78 | Loss: Close Day2 ($ 195.53) | Piercing Line | Buy |
| 007 18 Aug 2023 | Buy Price: 226.65 | Profit: Open Day1 ($ 226.80) | Piercing Line | Buy |
| 008 01 Aug 2023 | Sell Price: 238.01 | Profit: Open Day1 ($ 234.99) | Abandoned Baby | Sell |
| 009 30 Jun 2023 | Sell Price: 211.16 | Profit: Open Day1 ($ 210.50) | Dark Cloud Cover | Sell |
| 010One Year Average | Both Sides Result for 9 Signals |
Loss: $ -11.99 ($ -1.33 / Signal) |
All of Them | Buy + Sell |
| Simple Moving Averages (SMA) Period | Value $ | Signal | Exponential Moving Averages (EMA) Period | Value $ | Signal | |
|---|---|---|---|---|---|---|
| 2 | 167.04 | BUY | 2 | 167.03 | BUY | |
| 3 | 166.13 | BUY | 3 | 167.09 | BUY | |
| 5 | 167.61 | SELL | 5 | 167.56 | SELL | |
| 8 | 168.54 | SELL | 8 | 168.62 | SELL | |
| 13 | 169.56 | SELL | 13 | 170.79 | SELL | |
| 21 | 175.51 | SELL | 21 | 174.36 | SELL | |
| 34 | 179.55 | SELL | 34 | 179.72 | SELL | |
| 55 | 188.61 | SELL | 55 | 186.88 | SELL | |
| 90 | 204.22 | SELL | 90 | 194.55 | SELL | |
| 200 | 208.93 | SELL | 200 | 201.92 | SELL |
Common Stock
Manufacturing (
Aircraft
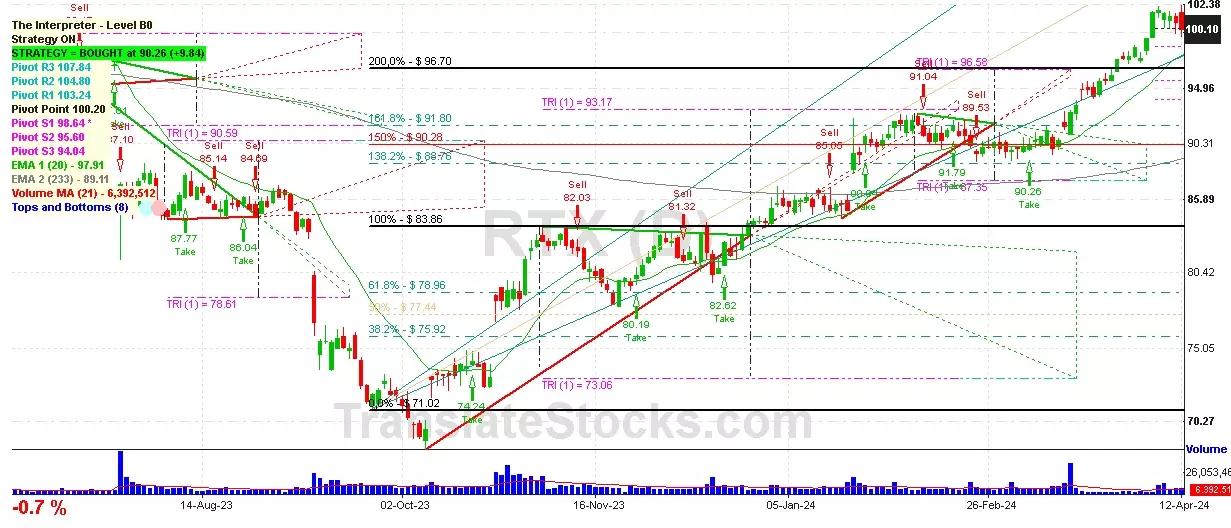
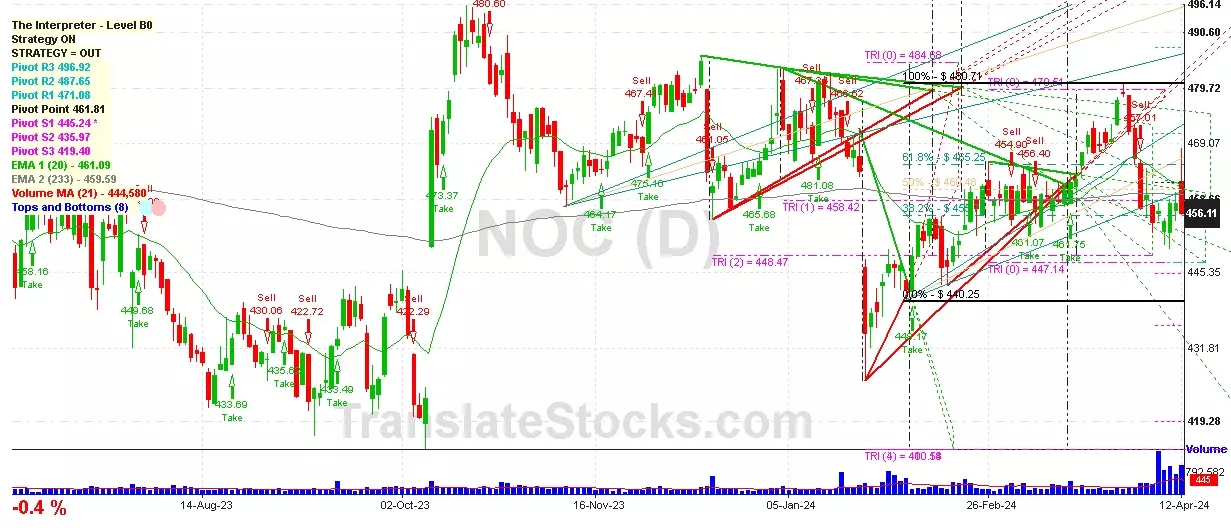
 Click to Enlarge
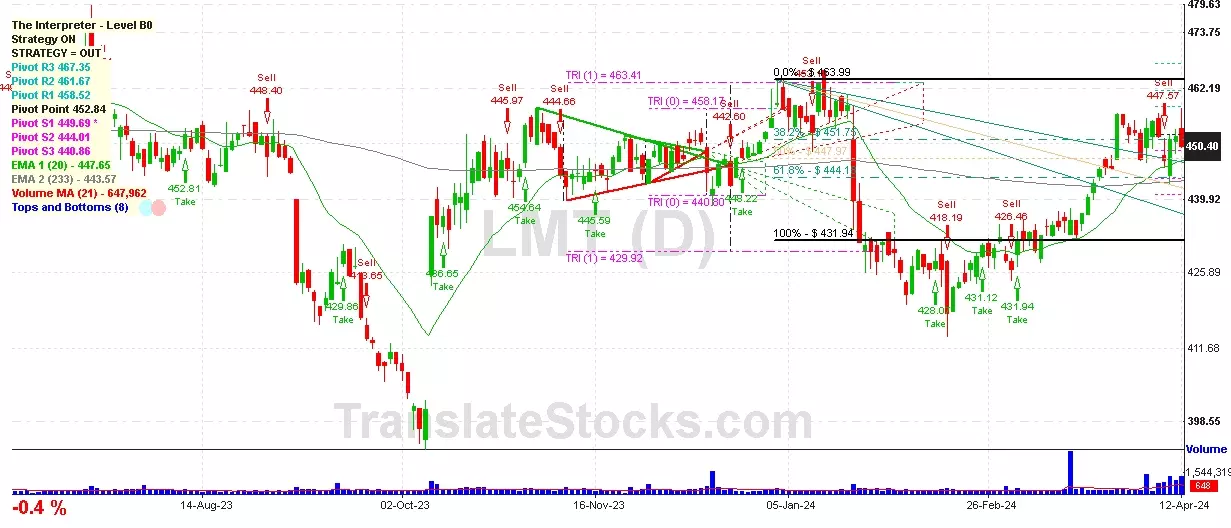
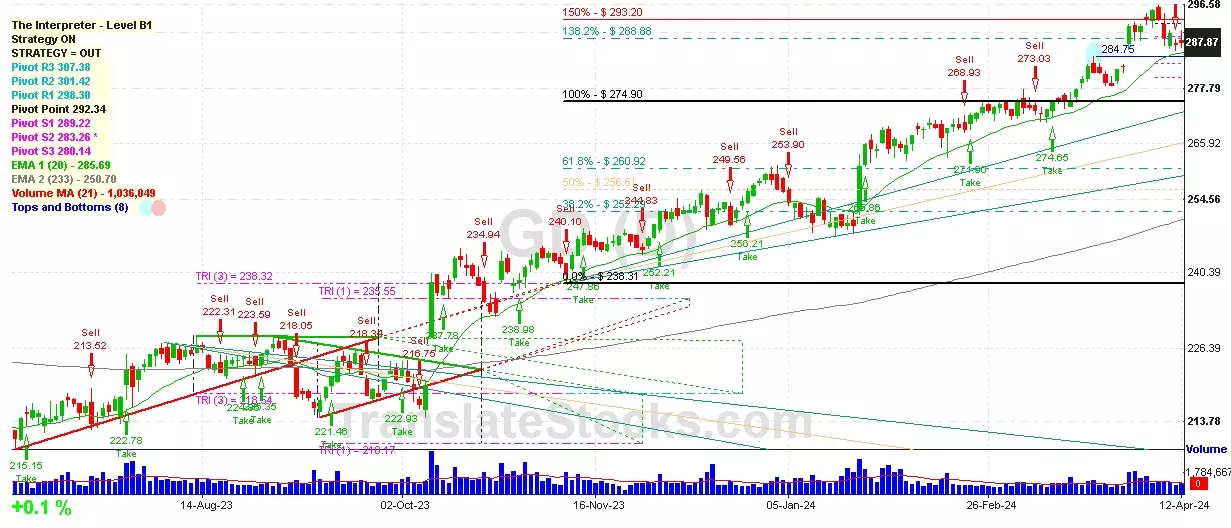