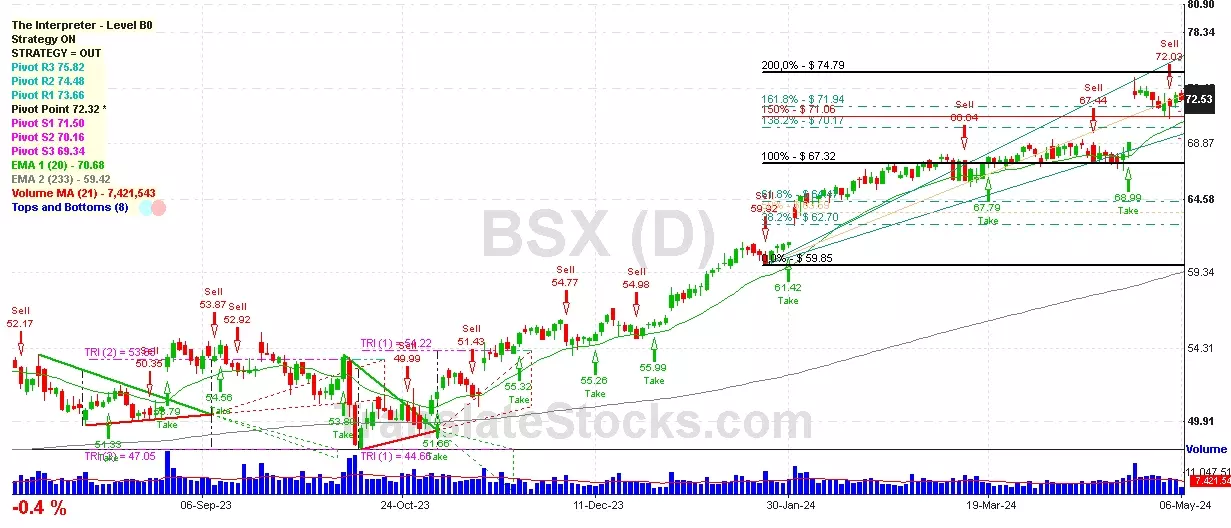
Hey Friend, I'm analysing BOSTON SCIENTIFIC CORP (BSX), and it is between the Support of $ 72.32 (Pivot) and the Resistance of $ 73.66 (PivotR1). The stock is also approaching the line of Pivot at $ 72.32, and if it goes below this line it could reach the next Support of 161.8% of Fibonacci at $ 71.94.

| Date | Price $ | Result % | Candle Name | Side |
|---|---|---|---|---|
| 001 11 Apr 2024 | Buy Price: 68.84 | Loss: Close Day2 ($ 67.43) | Abandoned Baby | Buy |
| 002 05 Mar 2024 | Sell Price: 67.02 | Loss: Close Day2 ($ 67.83) | Engulfing | Sell |
| 003 28 Feb 2024 | Buy Price: 66.99 | Profit: Close Day2 ($ 67.13) | Abandoned Baby | Buy |
| 004 26 Feb 2024 | Sell Price: 66.67 | Profit: Open Day1 ($ 66.26) | Engulfing | Sell |
| 005 14 Feb 2024 | Buy Price: 65.95 | Profit: Open Day1 ($ 66.12) | Abandoned Baby | Buy |
| 006 15 Nov 2023 | Sell Price: 53.85 | Loss: Close Day2 ($ 54.34) | Abandoned Baby | Sell |
| 007 18 Sep 2023 | Buy Price: 53.00 | Profit: Open Day1 ($ 53.01) | Engulfing | Buy |
| 008 08 Sep 2023 | Sell Price: 53.87 | Profit: Close Day2 ($ 53.43) | Abandoned Baby | Sell |
| 009 09 Aug 2023 | Buy Price: 51.06 | Profit: Open Day1 ($ 51.10) | Abandoned Baby | Buy |
| 010 18 Jul 2023 | Buy Price: 52.81 | Profit: Open Day1 ($ 52.98) | Piercing Line | Buy |
| 011 20 Jun 2023 | Sell Price: 54.04 | Profit: Open Day1 ($ 53.94) | Abandoned Baby | Sell |
| 012One Year Average | Both Sides Result for 11 Signals |
Loss: $ -1.23 ($ -0.11 / Signal) |
All of Them | Buy + Sell |
| Simple Moving Averages (SMA) Period | Value $ | Signal | Exponential Moving Averages (EMA) Period | Value $ | Signal | |
|---|---|---|---|---|---|---|
| 2 | 72.70 | SELL | 2 | 72.56 | SELL | |
| 3 | 72.47 | BUY | 3 | 72.51 | BUY | |
| 5 | 72.30 | BUY | 5 | 72.38 | BUY | |
| 8 | 72.55 | SELL | 8 | 72.04 | BUY | |
| 13 | 71.16 | BUY | 13 | 71.41 | BUY | |
| 21 | 70.07 | BUY | 21 | 70.59 | BUY | |
| 34 | 69.24 | BUY | 34 | 69.56 | BUY | |
| 55 | 68.30 | BUY | 55 | 68.05 | BUY | |
| 90 | 65.60 | BUY | 90 | 65.72 | BUY | |
| 200 | 58.57 | BUY | 200 | 60.53 | BUY |
Boston Scientific Corp
IPO: 1992-05-19
Ticker: BSXIndices: S&P 500,
Exchange: New York Stock Exchange, Inc. (US - USD)
Website: https://www.bostonscientific.com/
Phone:
Common Stock
Life Sciences (
Surgical & Medical Instruments & Apparatus
 Click to Enlarge