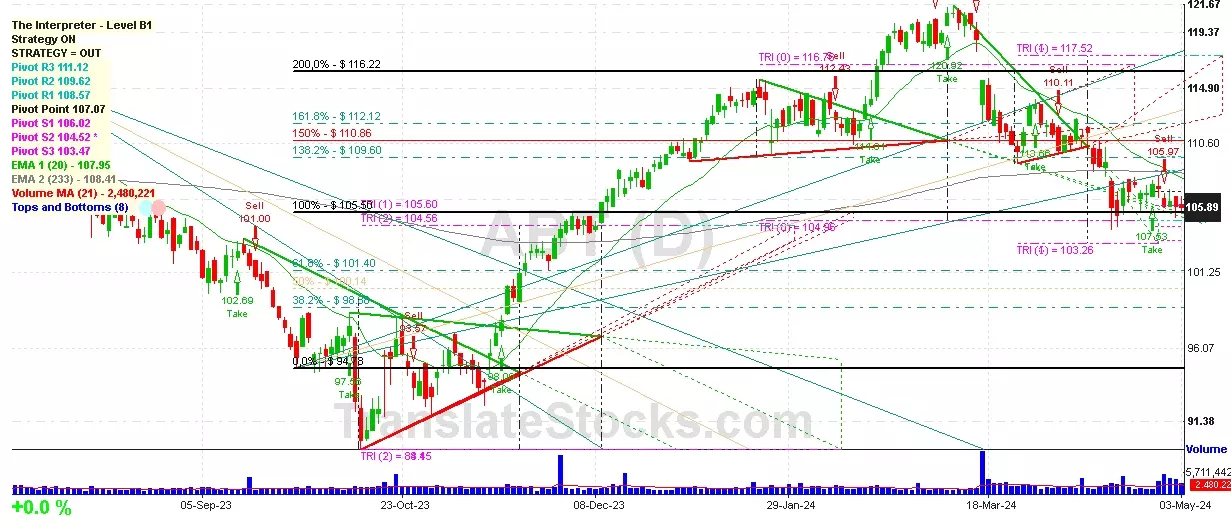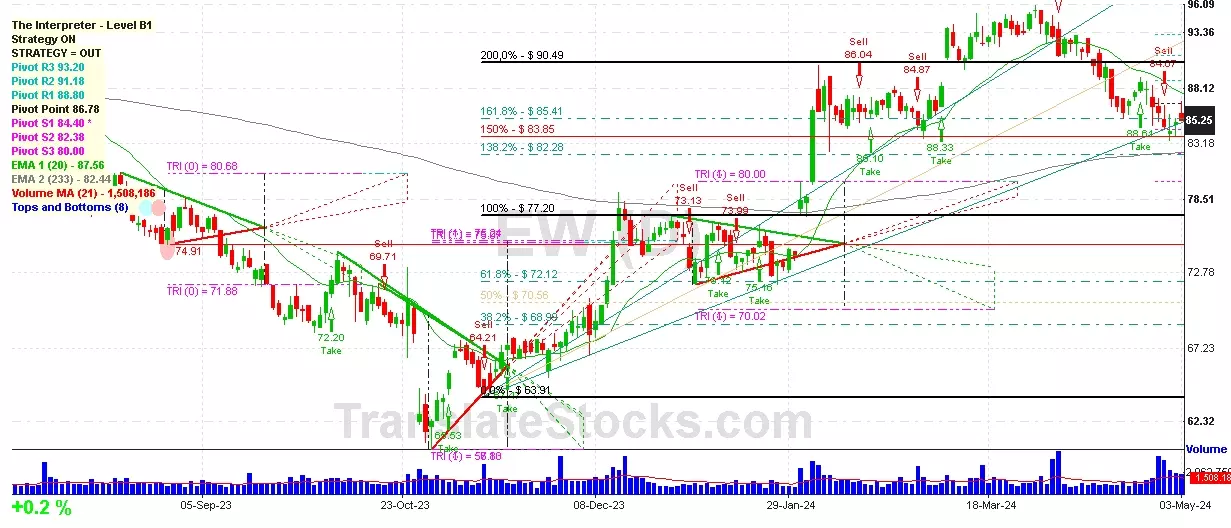
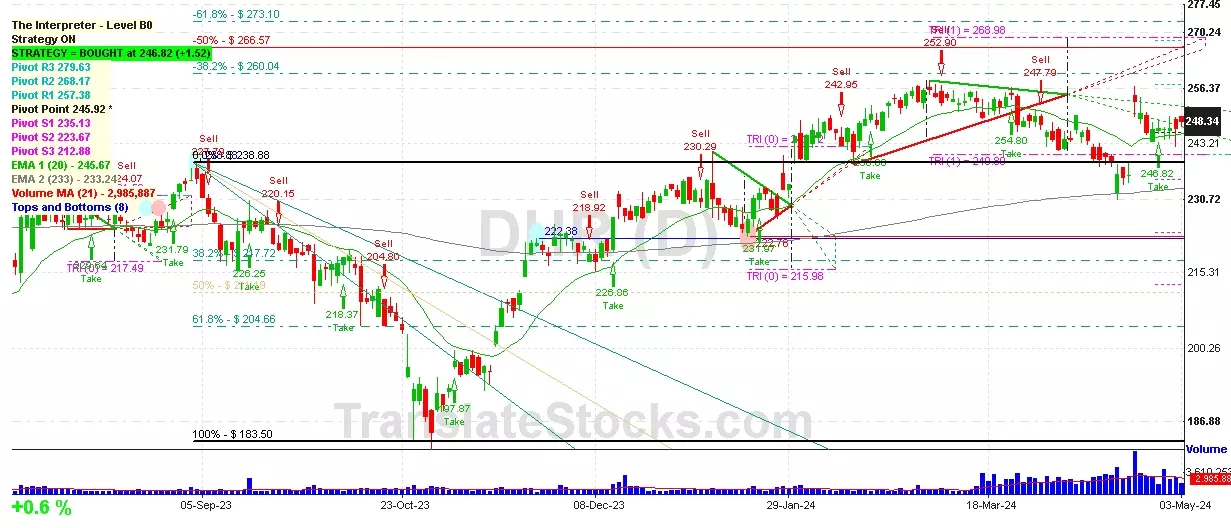
Hey Friend, I'm analysing DANAHER CORP (DHR), and it is between the Support of $ 245.92 (Pivot) and the Resistance of $ 257.38 (PivotR1). The stock is also approaching the line of Pivot at $ 245.92, and if it goes below this line it could reach the next Support of Triangle projection at $242.72.

| Date | Price $ | Result % | Candle Name | Side |
|---|---|---|---|---|
| 001 28 Mar 2024 | Buy Price: 250.01 | Loss: Close Day2 ($ 245.94) | Engulfing | Buy |
| 002 28 Mar 2024 | Buy Price: 249.72 | Loss: Close Day2 ($ 245.94) | Piercing Line | Buy |
| 003 14 Mar 2024 | Sell Price: 253.22 | Profit: Open Day1 ($ 250.71) | Abandoned Baby | Sell |
| 004 12 Mar 2024 | Buy Price: 253.10 | Profit: Open Day1 ($ 254.39) | Abandoned Baby | Buy |
| 005 12 Mar 2024 | Buy Price: 253.29 | Profit: Open Day1 ($ 254.39) | Engulfing | Buy |
| 006 02 Oct 2023 | Sell Price: 213.74 | Profit: Open Day1 ($ 212.68) | Abandoned Baby | Sell |
| 007 23 Aug 2023 | Buy Price: 254.86 | Profit: Open Day1 ($ 255.30) | Abandoned Baby | Buy |
| 008 02 Aug 2023 | Buy Price: 257.87 | Loss: Close Day2 ($ 254.84) | Engulfing | Buy |
| 009 05 Jul 2023 | Buy Price: 237.38 | Loss: Close Day2 ($ 233.10) | Piercing Line | Buy |
| 010 03 Jul 2023 | Sell Price: 236.81 | Profit: Open Day1 ($ 233.88) | Abandoned Baby | Sell |
| 011 22 Jun 2023 | Sell Price: 236.38 | Profit: Open Day1 ($ 234.81) | Dark Cloud Cover | Sell |
| 012 06 Jun 2023 | Buy Price: 234.92 | Profit: Close Day1 ($ 237.52) | Engulfing | Buy |
| 013 06 Jun 2023 | Buy Price: 234.65 | Profit: Close Day1 ($ 237.52) | Piercing Line | Buy |
| 014 05 Jun 2023 | Sell Price: 233.12 | Profit: Open Day1 ($ 232.24) | Engulfing | Sell |
| 015One Year Average | Both Sides Result for 14 Signals |
Profit: $ 2.09 ($ 0.15 / Signal) |
All of Them | Buy + Sell |
| Simple Moving Averages (SMA) Period | Value $ | Signal | Exponential Moving Averages (EMA) Period | Value $ | Signal | |
|---|---|---|---|---|---|---|
| 2 | 247.89 | SELL | 2 | 247.55 | SELL | |
| 3 | 247.54 | SELL | 3 | 247.50 | SELL | |
| 5 | 247.23 | BUY | 5 | 247.27 | BUY | |
| 8 | 246.92 | BUY | 8 | 246.77 | BUY | |
| 13 | 245.14 | BUY | 13 | 246.10 | BUY | |
| 21 | 244.29 | BUY | 21 | 245.84 | BUY | |
| 34 | 245.98 | BUY | 34 | 245.90 | BUY | |
| 55 | 248.66 | SELL | 55 | 244.96 | BUY | |
| 90 | 243.75 | BUY | 90 | 241.72 | BUY | |
| 200 | 229.75 | BUY | 200 | 234.14 | BUY |
Danaher Corp
IPO: 1969-12-10
Ticker: DHRIndices: S&P 500,
Exchange: New York Stock Exchange, Inc. (US - USD)
Website: https://www.danaher.com/
Phone:
Common Stock
Life Sciences (
Industrial Instruments For Measurement, Display, And Control
Year | 2020 | 2019 | 2018 | 2017 | 2016 | 2015 | 2014 | 2013 | 2012 | 2011 | 2010 | 2009 | 2008 | 2007 | 2006 | |
|---|---|---|---|---|---|---|---|---|---|---|---|---|---|---|---|---|
| 1 | Assets + | 76,161 | 62,082 | 47,832 | 46,649 | 45,295 | 48,222 | 36,992 | 34,672 | 32,941 | 29,950 | 22,217 | 19,595 | 17,490 | 9,480 | 318 |
| 2 | Real Estate Investment Property + | 0 | 0 | 0 | 0 | 0 | 0 | 0 | 0 | 0 | 0 | 122 | 111 | 0 | 0 | 0 |
| 3 | Real Estate Investment Property + | 0 | 0 | 0 | 0 | 0 | 0 | 0 | 0 | 0 | 0 | 122 | 111 | 0 | 0 | 0 |
| 4 | Investments in and Advance to Affiliates + | 0 | 0 | 0 | 0 | 0 | 0 | 0 | 0 | 548 | 522 | 511 | 0 | 0 | 0 | 0 |
| 5 | Cash and Cash Equivalents + | 0 | 19,912 | 788 | 630 | 964 | 791 | 3,006 | 3,115 | 1,679 | 537 | 1,633 | 1,722 | 393 | 239 | 318 |
| 6 | Property + | 3,262 | 2,302 | 2,511 | 2,455 | 2,354 | 2,826 | 2,203 | 2,211 | 2,141 | 2,101 | 1,192 | 1,143 | 1,109 | 0 | 0 |
| 7 | Property + | 6,444 | 5,063 | 5,340 | 4,974 | 4,317 | 5,498 | 4,797 | 4,511 | 4,103 | 3,767 | 2,715 | 2,714 | 0 | 0 | 0 |
| 8 | Intangible Assets + | 21,282 | 9,750 | 11,673 | 11,667 | 11,818 | 11,270 | 7,369 | 6,248 | 6,344 | 5,840 | 3,325 | 2,656 | 2,519 | 0 | 0 |
| 9 | Finite-Lived Intangible Assets + | 17,107 | 5,534 | 6,845 | 6,717 | 6,956 | 6,450 | 3,879 | 3,286 | 3,454 | 3,171 | 1,872 | 1,397 | 0 | 0 | 0 |
| 10 | Liabilities and Equity + | 76,161 | 62,082 | 47,832 | 46,649 | 45,295 | 48,222 | 36,992 | 34,672 | 32,941 | 29,950 | 22,217 | 19,595 | 17,490 | 1,086 | 0 |
| 11 | Liabilities + | 7,402 | 4,932 | 4,842 | 4,792 | 6,874 | 6,170 | 6,161 | 4,977 | 5,430 | 5,149 | 8,444 | 7,965 | 7,682 | 0 | 0 |
| 12 | Debt and Lease Obligation + | 0 | 0 | 0 | 0 | 0 | 0 | 765 | 450 | 1,224 | 977 | 180 | 180 | 0 | 0 | 0 |
| 13 | Stockholders' Equity + | 39,777 | 30,282 | 28,227 | 26,368 | 23,077 | 23,764 | 23,450 | 22,451 | 19,084 | 16,972 | 13,773 | 11,630 | 9,809 | 0 | 0 |
| 14 | Stockholders' Equity Attributable to Parent + | 39,766 | 30,271 | 28,214 | 26,358 | 23,003 | 23,690 | 23,378 | 22,385 | 19,016 | 16,905 | 13,711 | 11,630 | 9,809 | 0 | 0 |
| 15 | Stockholders' Equity + | 0.01 | 0.01 | 0.01 | 0.01 | 0.01 | 0.01 | 0.01 | 0.01 | 0.01 | 0.01 | 0.01 | 0.01 | 0.01 | 0 | 0 |
| 16 | Common Stock + | 0.01 | 0.01 | 0.01 | 0.01 | 0.01 | 0.01 | 0.01 | 0.01 | 0.01 | 0.01 | 0.01 | 0.01 | 0.01 | 0 | 0 |
| 17 | Partners' Capital + | 27,159 | 24,166 | 25,163 | 22,806 | 20,704 | 21,012 | 20,323 | 18,005 | 15,380 | 13,057 | 10,946 | 9,205 | 8,095 | 543 | 0 |
| 18 | Partners' Capital + | 27,159 | 24,166 | 25,163 | 22,806 | 20,704 | 21,012 | 20,323 | 18,005 | 15,380 | 13,057 | 10,946 | 9,205 | 8,095 | 543 | 0 |
| 19 | Limited Liability Company (LLC) Members' Equity + | 26,791 | 21,098 | 22,372 | 20,812 | 17,682 | 18,701 | 18,889 | 18,219 | 15,321 | 13,020 | 11,291 | 9,552 | 7,992 | 543 | 0 |
| 20 | Limited Liability Company (LLC) Members' Equity + | 26,791 | 21,098 | 22,372 | 20,812 | 17,682 | 18,701 | 18,889 | 18,219 | 15,321 | 13,020 | 11,291 | 9,552 | 7,992 | 543 | 0 |
| 21 | Current Assets + | 13,802 | 25,597 | 7,094 | 6,850 | 6,665 | 7,837 | 9,431 | 9,114 | 7,588 | 6,272 | 5,730 | 5,221 | 4,187 | 0 | 0 |
| 22 | Cash + | 176 | 111 | 149 | 0 | 0 | 0 | 0 | 0 | 0 | 0 | 0 | 0 | 0 | 0 | 0 |
| 23 | Current Other Undisclosed Receivables | 0 | 0 | 0 | 1,487 | 1,770 | 0 | 0 | 3,878 | 2,508 | 0 | 0 | 2,311 | 1,150 | 0 | 0 |
| 24 | Current Receivables + | 4,045 | 3,191 | 3,490 | 5,009 | 4,956 | 3,964 | 3,634 | 7,330 | 5,775 | 3,050 | 2,219 | 4,228 | 3,045 | 0 | 0 |
| 25 | Inventory + | 2,292 | 1,628 | 1,910 | 1,841 | 1,709 | 2,095 | 1,832 | 1,784 | 1,813 | 1,781 | 1,225 | 993 | 1,142 | 0 | 0 |
| 26 | Current Disposal Group + | 0 | 0 | 787 | 0 | 0 | 1,598 | 244 | 0 | 0 | 238 | 531 | 0 | 0 | 0 | 0 |
| 27 | Long-Term Assets + | 38,757 | 25,197 | 26,554 | 25,677 | 24,458 | 26,289 | 17,988 | 17,099 | 16,320 | 15,214 | 11,095 | 10,576 | 9,675 | 9,241 | 0 |
| 28 | Long-Term Disposal Group + | 0 | 0 | 131 | 0 | 0 | 5,677 | 1,639 | 0 | 0 | 0 | 0 | 0 | 0 | 0 | 0 |
| 29 | Current Liabilities + | 7,402 | 4,932 | 4,842 | 4,792 | 6,874 | 6,170 | 5,396 | 4,527 | 4,206 | 4,172 | 3,305 | 2,761 | 2,745 | 0 | 0 |
| 30 | Long-Term Other Undisclosed Liabilities | 0 | 0 | 0 | 0 | 0 | 0 | 0 | 0 | 0 | 0 | 0 | 0 | 1 | 0 | 0 |
| 31 | Long-Term Liabilities + | 34,953 | 30,975 | 18,887 | 19,211 | 15,470 | 18,883 | 8,384 | 7,786 | 9,745 | 8,806 | 5,140 | 5,204 | 4,937 | 0 | 0 |
| 32 | Total Current Assets + | 13,802 | 25,597 | 7,094 | 6,850 | 6,665 | 7,837 | 9,431 | 9,114 | 7,588 | 6,272 | 5,730 | 5,221 | 4,187 | 0 | 0 |
| 33 | Operating Lease + | 942 | 764 | 0 | 0 | 0 | 0 | 0 | 0 | 0 | 0 | 0 | 0 | 0 | 0 | 0 |
| 34 | Goodwill + | 35,420 | 22,712 | 25,906 | 25,139 | 23,827 | 25,070 | 16,964 | 16,038 | 15,462 | 14,474 | 10,394 | 9,818 | 9,211 | 9,241 | 0 |
| 35 | Long-Term Other Assets + | 2,395 | 1,721 | 648 | 538 | 631 | 1,219 | 1,024 | 1,061 | 858 | 740 | 701 | 758 | 464 | 0 | 0 |
| 36 | Total Assets + | 76,161 | 62,082 | 47,832 | 46,649 | 45,295 | 48,222 | 36,992 | 34,672 | 32,941 | 29,950 | 22,217 | 19,595 | 17,490 | 0 | 0 |
| 37 | Total Liabilities + | 0 | 0 | 0 | 0 | 0 | 0 | 0 | 0 | 0 | 0 | 8,444 | 7,965 | 7,682 | 0 | 0 |
| 38 | Stockholders' Equity Attributable to Noncontrolling Interest + | 11 | 11 | 12 | 10 | 74 | 74 | 72 | 66 | 67 | 67 | 62 | 0 | 0 | 0 | 0 |
| 39 | Total Stockholders' Equity + | 39,777 | 30,282 | 28,227 | 26,368 | 23,077 | 23,764 | 23,450 | 22,451 | 19,084 | 16,972 | 13,773 | 11,630 | 0 | 0 | 0 |
| 40 | Total Liabilities and Equity + | 76,161 | 62,082 | 47,832 | 46,649 | 45,295 | 48,222 | 36,992 | 34,672 | 32,941 | 29,950 | 22,217 | 19,595 | 17,490 | 0 | 0 |
Year | 2020 | 2019 | 2018 | 2017 | 2016 | 2015 | 2014 | 2013 | 2012 | 2011 | 2010 | 2009 | 2008 | 2007 | |
|---|---|---|---|---|---|---|---|---|---|---|---|---|---|---|---|
| 1 | 0 | 0 | 19,893 | 18,330 | 16,882 | 0 | 0 | 0 | 0 | 0 | 0 | 0 | 0 | 0 | |
| 2 | -9,809 | -7,927 | -8,786 | -8,137 | -7,548 | -9,801 | -9,471 | -9,160 | -8,846 | -7,914 | -6,146 | -5,905 | -6,757 | -5,985 | |
| 3 | 12,475 | 9,984 | 11,107 | 10,192 | 9,335 | 10,762 | 10,442 | 9,958 | 9,414 | 8,177 | 6,404 | 5,280 | 5,940 | 0 | |
| 4 | 1,348 | 1,126 | 1,231 | 1,129 | 975 | 1,239 | 1,314 | 1,250 | 1,138 | 1,018 | 774 | 633 | 725 | 601 | |
| 5 | 0 | 0 | 0 | 0 | 0 | 0 | 0 | 0 | 0 | 57 | 36 | 24 | 0 | 0 | |
| 6 | 6,896 | 5,588 | 6,472 | 6,042 | 5,609 | 6,054 | 5,697 | 5,433 | 5,181 | 4,608 | 3,604 | 3,190 | 3,345 | 2,713 | |
| 7 | 31 | 30 | 36 | 33 | 33 | 57 | 43 | 30 | 40 | 40 | 47 | 43 | 0 | 0 | |
| 8 | 0 | 0 | 0 | 0 | 0 | 0 | 0 | 230 | 0 | 0 | 0 | 0 | 0 | 0 | |
| 9 | 4,231 | 3,269 | 3,404 | 3,021 | 2,751 | 3,469 | 3,431 | 3,275 | 3,165 | 2,617 | 2,050 | 1,542 | 1,869 | 1,741 | |
| 10 | 18 | 0 | 0 | 0 | 0 | 0 | 0 | 0 | 0 | 0 | 0 | 0 | 0 | 0 | |
| 11 | 473 | 0 | 0 | 0 | 0 | 0 | 34 | 0 | 0 | 0 | 0 | 0 | 0 | 0 | |
| 12 | 71 | 139 | 9 | 8 | 0 | 5 | 17 | 6 | 3 | 5 | 6 | 5 | 10 | 6 | |
| 13 | 5 | 12 | 37 | 73 | 223 | 12 | 156 | 431 | 0 | 0 | 0 | 0 | 0 | 0 | |
| 14 | 39 | 12 | 35 | 0 | 0 | 0 | 0 | 0 | 0 | 0 | 0 | 0 | 0 | 0 | |
| 15 | 275 | 109 | 157 | 163 | 184 | 163 | 123 | 146 | 158 | 142 | 117 | 123 | 130 | 110 | |
| 16 | 26 | 6 | 0 | 0 | 179 | 0 | 0 | 0 | 0 | 33 | 0 | 0 | 0 | 0 | |
| 17 | 0 | 0 | 0 | 0 | 0 | 0 | 0 | 0 | 0 | 0 | 2,343 | 1,425 | 1,749 | 1,637 | |
| 18 | 0 | 0 | 0 | 0 | 0 | 0 | 0 | 0 | 70 | 67 | 23 | 0 | 0 | 0 | |
| 19 | 4,495 | 3,305 | 3,293 | 2,939 | 2,611 | 3,324 | 3,482 | 3,566 | 3,011 | 2,448 | 2,230 | 1,326 | 0 | 0 | |
| 20 | -849 | -873 | -642 | -469 | -458 | -725 | -883 | -871 | -712 | -512 | -511 | -273 | -432 | -423 | |
| 21 | 0 | 180 | 331 | 396 | 557 | 14 | 81 | 150 | -1 | 56 | 113 | 99 | 0 | 0 | |
| 22 | 0 | 0 | 0 | 0 | 0 | 0 | 0 | 0 | -1 | 76 | 151 | 133 | 0 | 0 | |
| 23 | 0 | 0 | 0 | 0 | 0 | 0 | 0 | 0 | -1 | 35 | 75 | 65 | 0 | 0 | |
| 24 | 0 | 451 | 0 | 0 | 0 | 760 | 0 | 0 | 0 | 0 | 0 | 0 | 0 | 0 | |
| 25 | 0 | 0 | 0 | 0 | 0 | 0 | 0 | 0 | 55 | 126 | 0 | 0 | 0 | 0 | |
| 26 | 0 | 0 | 0 | 0 | 0 | 0 | 0 | 0 | 94 | 202 | 0 | 0 | 0 | 0 | |
| 27 | 0 | 631 | 331 | 396 | 557 | 775 | 81 | 150 | 0 | 0 | 0 | 0 | 0 | 0 | |
| 28 | 0 | 590 | 245 | 418 | 400 | 759 | 55 | 105 | 0 | 0 | 0 | 0 | 0 | 0 | |
| 29 | 0 | 589 | 245 | 22 | 400 | 759 | 55 | 104 | 93 | 237 | 75 | 65 | 0 | 156 | |
| 30 | Total Net Income (Loss) Attributable to Parent + | 3,646 | 3,008 | 2,651 | 2,492 | 2,554 | 3,357 | 2,598 | 2,695 | 2,392 | 2,172 | 1,793 | 1,152 | 1,318 | 1,370 |
| 31 | Preferred Stock Dividends + | 136 | 68 | 0 | 0 | 0 | 0 | 0 | 0 | 0 | 0 | 0 | 0 | 0 | 0 |
| 32 | 3,510 | 2,940 | 2,651 | 2,492 | 0 | 0 | 0 | 0 | 0 | 0 | 1,793 | 1,152 | 1,318 | 0 | |
| 33 | Total Income (Loss) from Continuing Operations + | 3,646 | 2,432 | 2,651 | 2,470 | 2,153 | 2,599 | 2,598 | 2,695 | 2,299 | 1,935 | 1,718 | 1,152 | 1,318 | 1,214 |
| 34 | Income (Loss) from Discontinued Operations + | 0 | 589 | 245 | 22 | 400 | 759 | 55 | 104 | 93 | 237 | 75 | 65 | 0 | 156 |
| 35 | Income (Loss) from Discontinued Operations + | 0 | 602 | 0 | 0 | 0 | 0 | 0 | 0 | 0 | 0 | 0 | 0 | 0 | 0 |
| 36 | Total Income (Loss) from Discontinued Operations + | 0 | 576 | 245 | 320 | 0 | 0 | 0 | 0 | 0 | 0 | 0 | 0 | 0 | 0 |
| 37 | Income (Loss) from Continuing Operations + | 4.97 | 3.31 | 3.78 | 3.55 | 3.12 | 3.72 | 3.70 | 3.87 | 3.32 | 2.86 | 2.63 | 3.59 | 4.13 | 3.90 |
| 38 | 0 | 0.81 | 0.35 | 0.03 | 0.58 | 1.09 | 0.08 | 0.15 | 0.13 | 0.35 | 0.11 | 0.10 | 0 | 0.50 | |
| 39 | Total Earnings Per Share + | 4.97 | 4.11 | 3.78 | 3.58 | 3.69 | 4.81 | 3.70 | 3.87 | 3.45 | 3.21 | 2.74 | 3.59 | 4.13 | 4.40 |
| 40 | Income (Loss) from Continuing Operations + | 4.97 | 3.31 | 3.78 | 3.55 | 3.12 | 3.72 | 3.70 | 3.87 | 3.32 | 2.86 | 2.63 | 3.59 | 4.13 | 3.90 |
| 41 | Income (Loss) from Continuing Operations + | 4.89 | 3.26 | 3.74 | 3.50 | 3.08 | 3.67 | 3.63 | 3.80 | 3.23 | 2.77 | 2.53 | 3.46 | 3.95 | 3.72 |
| 42 | 0 | 0.79 | 0.34 | 0.03 | 0.57 | 1.07 | 0.08 | 0.15 | 0.13 | 0.34 | 0.11 | 0.10 | 0 | 0.47 | |
| 43 | Total Earnings Per Share + | 4.89 | 4.05 | 3.74 | 3.53 | 3.65 | 4.74 | 3.63 | 3.80 | 3.36 | 3.11 | 2.64 | 3.46 | 3.95 | 4.19 |
| 44 | 0 | 631 | 331 | 396 | 557 | 775 | 81 | 150 | 0 | 0 | 0 | 0 | 0 | 0 |
 Click to Enlarge