| Date | Price $ | Result % | Candle Name | Side |
|---|---|---|---|---|
| 001 09 May 2024 | Buy Price: 130.56 | Profit: Open Day1 ($ 130.81) | Abandoned Baby | Buy |
| 002 02 May 2024 | Buy Price: 131.80 | Loss: Close Day2 ($ 130.48) | Abandoned Baby | Buy |
| 003 22 Mar 2024 | Sell Price: 124.84 | Loss: Close Day2 ($ 125.78) | Engulfing | Sell |
| 004 15 Sep 2023 | Sell Price: 132.18 | Profit: Close Day1 ($ 131.88) | Abandoned Baby | Sell |
| 005 26 Jun 2023 | Buy Price: 109.75 | Profit: Open Day1 ($ 109.78) | Abandoned Baby | Buy |
| 006 26 Jun 2023 | Buy Price: 110.00 | Profit: Close Day2 ($ 111.19) | Engulfing | Buy |
| 007 22 May 2023 | Sell Price: 113.55 | Profit: Close Day1 ($ 113.46) | Abandoned Baby | Sell |
| 008One Year Average | Both Sides Result for 7 Signals |
Loss: $ -0.40 ($ -0.06 / Signal) |
All of Them | Buy + Sell |
| Simple Moving Averages (SMA) Period | Value $ | Signal | Exponential Moving Averages (EMA) Period | Value $ | Signal | |
|---|---|---|---|---|---|---|
| 2 | 128.93 | BUY | 2 | 129.41 | BUY | |
| 3 | 128.98 | BUY | 3 | 129.29 | BUY | |
| 5 | 129.16 | BUY | 5 | 129.34 | BUY | |
| 8 | 129.53 | BUY | 8 | 129.64 | BUY | |
| 13 | 129.91 | BUY | 13 | 130.20 | SELL | |
| 21 | 131.70 | SELL | 21 | 130.65 | SELL | |
| 34 | 132.77 | SELL | 34 | 130.17 | SELL | |
| 55 | 128.87 | BUY | 55 | 128.50 | BUY | |
| 90 | 122.70 | BUY | 90 | 126.43 | BUY | |
| 200 | 124.59 | BUY | 200 | 123.99 | BUY |
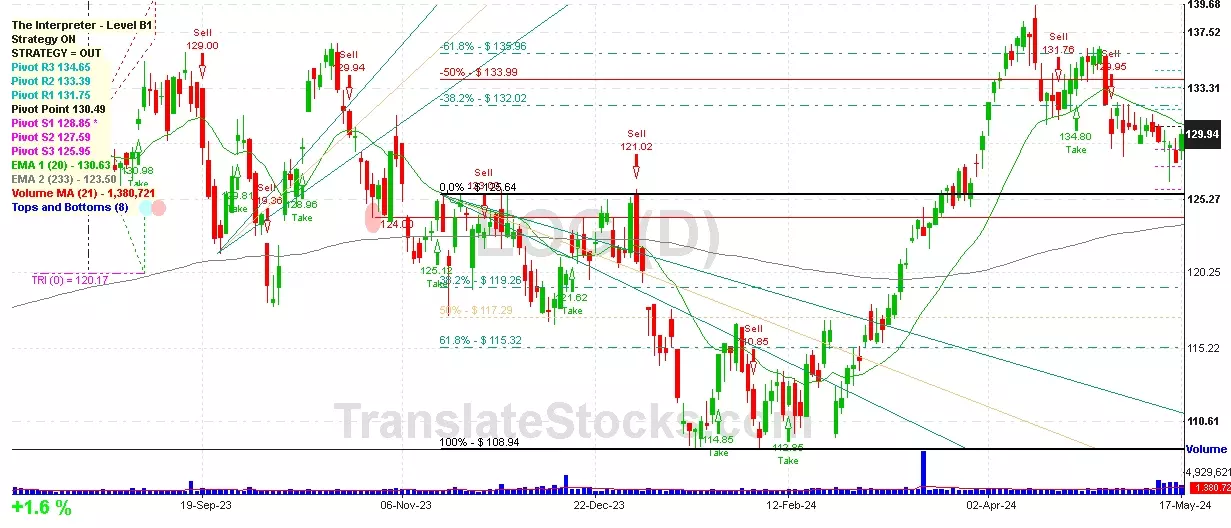
Eog Resources Inc
IPO: 1989-10-04
Ticker: EOGIndices: S&P 500,
Exchange: New York Stock Exchange, Inc. (US - USD)
Website: http://www.eogresources.com
Phone:
Common Stock
Energy & Transportation (
Crude Petroleum & Natural Gas
Year | 2020 | 2019 | 2018 | 2017 | 2016 | 2015 | 2014 | 2013 | 2012 | 2011 | 2010 | 2009 | 2008 | 2007 | 2006 | |
|---|---|---|---|---|---|---|---|---|---|---|---|---|---|---|---|---|
| 1 | Assets + | 35,805 | 37,125 | 33,934 | 29,833 | 29,459 | 26,975 | 34,763 | 30,574 | 27,337 | 24,839 | 21,624 | 18,119 | 15,951 | 54 | 218 |
| 2 | Cash and Cash Equivalents + | 3,329 | 2,028 | 1,556 | 834 | 1,600 | 719 | 2,087 | 1,318 | 876 | 616 | 789 | 686 | 331 | 54 | 218 |
| 3 | Property + | 28,599 | 30,365 | 28,076 | 25,665 | 25,707 | 24,211 | 29,173 | 26,149 | 23,338 | 21,289 | 18,681 | 16,139 | 13,657 | 0 | 0 |
| 4 | Property + | 69,272 | 67,303 | 61,551 | 56,516 | 53,601 | 54,600 | 50,254 | 45,789 | 40,867 | 35,814 | 30,997 | 25,964 | 21,862 | 0 | 0 |
| 5 | Liabilities and Equity + | 35,805 | 37,125 | 33,934 | 29,833 | 29,459 | 26,975 | 34,763 | 30,574 | 27,337 | 24,839 | 21,624 | 18,119 | 15,951 | 6,990 | 5,600 |
| 6 | Liabilities + | 3,460 | 4,487 | 3,728 | 2,726 | 2,027 | 1,819 | 3,384 | 2,862 | 2,924 | 2,522 | 2,220 | 1,346 | 1,765 | 0 | 0 |
| 7 | Stockholders' Equity + | 20,302 | 21,641 | 19,364 | 16,283 | 13,982 | 12,943 | 17,713 | 15,418 | 13,285 | 12,641 | 10,232 | 9,998 | 9,014 | 6,990 | 5,600 |
| 8 | Stockholders' Equity Attributable to Parent + | 206 | 206 | 206 | 206 | 206 | 206 | 205 | 203 | 203 | 203 | 203 | 203 | 202 | 0 | 0 |
| 9 | Stockholders' Equity + | 0.01 | 0.01 | 0.01 | 0.01 | 0.01 | 0.01 | 0.01 | 0.01 | 0.01 | 0.01 | 0.01 | 0.01 | 0.01 | 0 | 0 |
| 10 | Preferred Stock + | 0 | 0 | 0 | 0 | 0 | 0 | 0 | 0 | 0 | 0 | 0 | 0 | 0 | 0 | 0 |
| 11 | Common Stock + | 0.01 | 0.01 | 0.01 | 0.01 | 0.01 | 0.01 | 0.01 | 0.01 | 0.01 | 0.01 | 0.01 | 0.01 | 0.01 | 0 | 0 |
| 12 | Partners' Capital + | 14,170 | 15,649 | 13,543 | 10,594 | 8,398 | 9,871 | 14,763 | 12,168 | 10,176 | 9,789 | 8,870 | 8,867 | 8,466 | 0 | 0 |
| 13 | Partners' Capital + | 14,170 | 15,649 | 13,543 | 10,594 | 8,398 | 9,871 | 14,763 | 12,168 | 10,176 | 9,789 | 8,870 | 8,867 | 8,466 | 0 | 0 |
| 14 | Limited Liability Company (LLC) Members' Equity + | 14,158 | 15,644 | 13,542 | 10,575 | 8,379 | 9,838 | 14,740 | 12,584 | 10,616 | 10,191 | 9,310 | 9,207 | 8,494 | 0 | 0 |
| 15 | Limited Liability Company (LLC) Members' Equity + | 14,158 | 15,644 | 13,542 | 10,575 | 8,379 | 9,838 | 14,740 | 12,584 | 10,616 | 10,191 | 9,310 | 9,207 | 8,494 | 0 | 0 |
| 16 | Current Assets + | 5,862 | 5,273 | 5,057 | 3,279 | 3,555 | 2,592 | 5,416 | 4,072 | 3,590 | 3,254 | 2,527 | 1,840 | 2,108 | 0 | 0 |
| 17 | Current Receivables + | 1,522 | 2,002 | 1,915 | 1,597 | 1,216 | 931 | 1,779 | 1,659 | 1,657 | 1,451 | 1,113 | 771 | 723 | 0 | 0 |
| 18 | Inventory + | 629 | 767 | 859 | 484 | 350 | 0 | 0 | 0 | 0 | 0 | 0 | 0 | 0 | 0 | 0 |
| 19 | Derivative Instruments and Hedges + | 65 | 1 | 24 | 8 | 0 | 0 | 465 | 8 | 166 | 451 | 48 | 21 | 779 | 0 | 0 |
| 20 | Long-Term Assets + | 1,342 | 1,484 | 1,367 | 871 | 198 | 172 | 174 | 353 | 409 | 296 | 416 | 140 | 185 | 0 | 0 |
| 21 | Long-Term Derivative Instruments and Hedges + | 0 | 0 | 0 | 0 | 0 | 0 | 0 | 0 | 0 | 0 | 2 | 0 | 0 | 0 | 0 |
| 22 | Current Liabilities + | 3,460 | 4,487 | 3,728 | 2,726 | 2,027 | 1,819 | 3,384 | 2,862 | 2,924 | 2,522 | 2,220 | 1,346 | 1,765 | 0 | 0 |
| 23 | Long-Term Liabilities + | 7,183 | 5,951 | 6,428 | 7,306 | 8,262 | 7,625 | 6,842 | 6,772 | 6,801 | 5,808 | 5,670 | 3,393 | 2,358 | 0 | 0 |
| 24 | Increase (Decrease) in Stockholders' Equity [Roll Forward] + | -7 | -27 | -42 | -33 | -24 | -23 | -70 | -15 | -34 | -25 | -11 | 8 | 6 | 0 | 0 |
| 25 | Treasury Stock Transactions + | -7 | -27 | -42 | -33 | -24 | -23 | -70 | -15 | -34 | -25 | -11 | 8 | 6 | 0 | 0 |
| 26 | Treasury Stock + | -7 | -27 | -42 | -33 | -24 | -23 | -70 | -15 | -34 | -25 | -11 | 8 | 6 | 0 | 0 |
| 27 | Current Other Assets + | 294 | 323 | 275 | 242 | 207 | 156 | 287 | 274 | 178 | 119 | 97 | 63 | 60 | 0 | 0 |
| 28 | Total Current Assets + | 5,862 | 5,273 | 5,057 | 3,279 | 3,555 | 2,592 | 5,416 | 4,072 | 3,590 | 3,254 | 2,527 | 1,840 | 2,108 | 0 | 0 |
| 29 | Operating Lease + | 0 | 0 | 566 | 0 | 0 | 0 | 0 | 0 | 0 | 0 | 0 | 0 | 0 | 0 | 0 |
| 30 | Long-Term Other Assets + | 1,342 | 1,484 | 801 | 871 | 198 | 172 | 174 | 353 | 409 | 296 | 416 | 140 | 185 | 0 | 0 |
| 31 | Total Assets + | 35,805 | 37,125 | 33,934 | 29,833 | 29,459 | 26,975 | 34,763 | 30,574 | 27,337 | 24,839 | 21,624 | 18,119 | 15,951 | 0 | 0 |
| 32 | Total Stockholders' Equity + | 20,302 | 21,641 | 19,364 | 16,283 | 13,982 | 12,943 | 17,713 | 15,418 | 13,285 | 12,641 | 10,232 | 9,998 | 9,014 | 6,990 | 5,600 |
| 33 | Total Liabilities and Equity + | 35,805 | 37,125 | 33,934 | 29,833 | 29,459 | 26,975 | 34,763 | 30,574 | 27,337 | 24,839 | 21,624 | 18,119 | 15,951 | 0 | 0 |
Year | 2020 | 2019 | 2018 | 2017 | 2016 | 2015 | 2014 | 2013 | 2012 | 2011 | 2010 | 2009 | 2008 | 2007 | |
|---|---|---|---|---|---|---|---|---|---|---|---|---|---|---|---|
| 1 | 11,032 | 17,380 | 17,275 | 11,208 | 7,651 | 8,757 | 18,035 | 14,487 | 11,683 | 10,126 | 6,100 | 4,787 | 7,127 | 4,239 | |
| 2 | 146 | 140 | 149 | 145 | 125 | 149 | 184 | 161 | 186 | 172 | 187 | 170 | 194 | 150 | |
| 3 | 47 | 43 | 37 | 35 | 32 | 32 | 41 | 35 | 30 | 28 | 25 | 24 | 0 | 0 | |
| 4 | 1,063 | 1,367 | 1,283 | 1,045 | 927 | 1,182 | 0 | 0 | 0 | 0 | 0 | 0 | 0 | 0 | |
| 5 | 484 | 489 | 427 | 434 | 395 | 367 | 402 | 348 | 332 | 305 | 280 | 248 | 244 | 205 | |
| 6 | 47 | -124 | -175 | 99 | -206 | 9 | -15 | -23 | -10 | -5 | 0 | 0 | 0 | 0 | |
| 7 | -544 | 3,699 | 4,469 | 926 | -1,225 | -6,686 | 5,242 | 3,675 | 1,480 | 2,113 | 523 | 971 | 3,767 | 1,648 | |
| 8 | 0 | 0 | 0 | 0 | 0 | 0 | 0 | 0 | 9 | 5 | 0 | 0 | 0 | 0 | |
| 9 | 12 | 26 | 12 | 8 | 3 | 3 | 2 | 6 | 9 | 1 | 1 | 1 | 0 | 0 | |
| 10 | -2 | 5 | 5 | 1 | 0 | 0 | 0 | 0 | 0 | 0 | 0 | 0 | 0 | 0 | |
| 11 | 0 | 0 | 0 | 0 | -53 | -2 | 0 | 0 | 0 | 0 | 0 | 0 | 0 | 0 | |
| 12 | 10 | 31 | 17 | 9 | -51 | 2 | -45 | -3 | 14 | 7 | 14 | 2 | 31 | 29 | |
| 13 | 236 | 223 | 270 | 302 | 313 | 279 | 259 | 285 | 263 | 268 | 206 | 156 | 94 | 76 | |
| 14 | 240 | 225 | 0 | 0 | 0 | 0 | 0 | 0 | 0 | 0 | 0 | 0 | 0 | 0 | |
| 15 | 205 | 185 | 245 | 274 | 282 | 237 | 201 | 235 | 214 | 210 | 130 | 101 | 0 | 0 | |
| 16 | -2 | 0 | 2 | 3 | 4 | 9 | 8 | 11 | 20 | 17 | 0 | 0 | 0 | 0 | |
| 17 | -739 | 3,545 | 4,241 | 661 | -1,558 | -6,922 | 0 | 0 | 0 | 0 | 0 | 0 | 0 | 0 | |
| 18 | 134 | -810 | -822 | 1,921 | 461 | 2,397 | -2,080 | -1,240 | -710 | -819 | -247 | -325 | -1,310 | -541 | |
| 19 | Total Net Income (Loss) Attributable to Parent + | -605 | 2,735 | 3,419 | 2,583 | -1,097 | -4,525 | 2,915 | 2,197 | 570 | 1,091 | 161 | 547 | 2,437 | 1,090 |
| 20 | 0 | 0 | 0 | 0 | 0 | 0 | 0 | 0 | 0 | 0 | 161 | 547 | 2,436 | 1,083 | |
| 21 | Total Earnings Per Share + | -1.04 | 4.73 | 5.93 | 4.49 | -1.98 | -8.29 | 5.36 | 8.13 | 2.13 | 4.15 | 0.64 | 2.20 | 9.88 | 4.45 |
| 22 | Total Earnings Per Share + | -1.04 | 4.71 | 5.89 | 4.46 | -1.98 | -8.29 | 5.32 | 8.04 | 2.11 | 4.10 | 0.63 | 2.17 | 9.72 | 4.37 |
| 23 | 1.50 | 1.08 | 0.81 | 0.67 | 0.67 | 0.67 | 0.58 | 0.75 | 0.68 | 0.64 | 0.62 | 0.58 | 0.51 | 0.36 | |
| 24 | 0 | 0 | 0 | 0.84 | 0.84 | 0.84 | 0 | 0 | 0 | 0 | 0 | 0 | 0 | 0 |

 Click to Enlarge