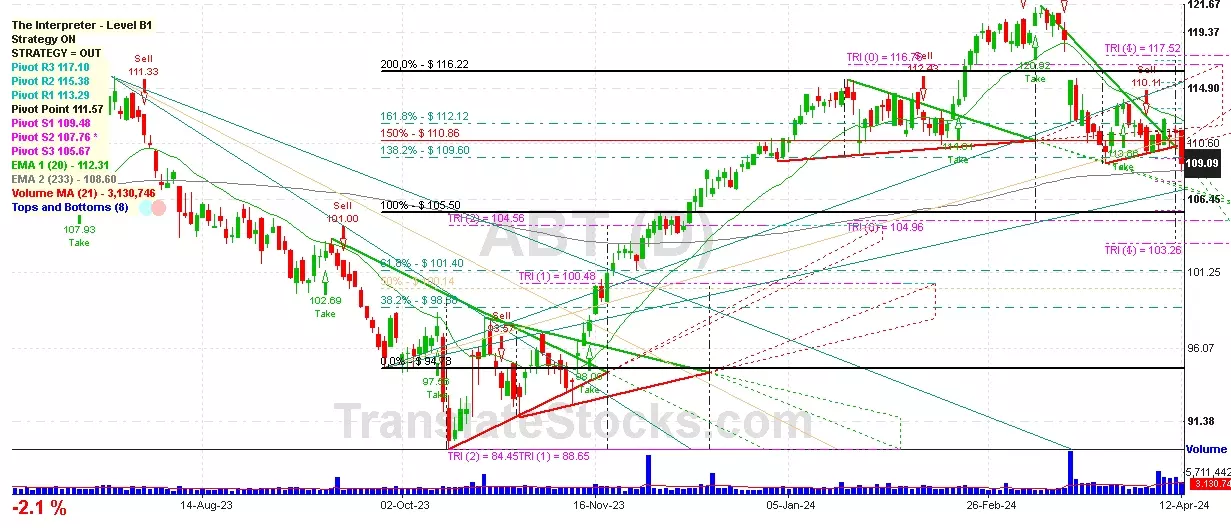
| Date | Price $ | Result % | Candle Name | Side |
|---|---|---|---|---|
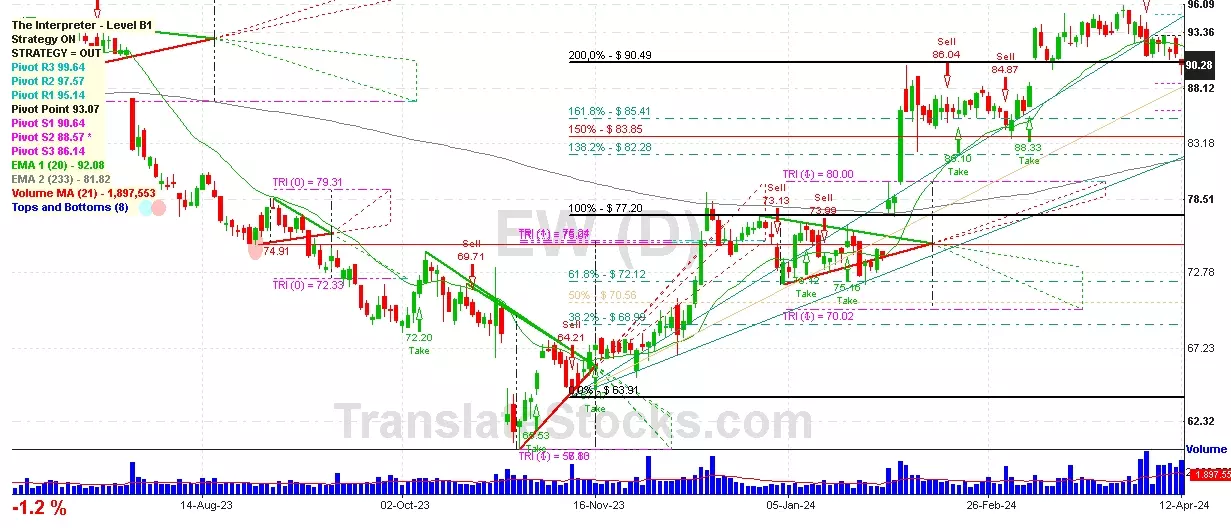
| 001 01 Apr 2024 | Sell Price: 94.25 | Profit: Open Day1 ($ 93.45) | Engulfing | Sell |
| 002 15 Mar 2024 | Sell Price: 92.31 | Loss: Close Day2 ($ 94.31) | Abandoned Baby | Sell |
| 003 26 Feb 2024 | Sell Price: 86.15 | Profit: Open Day1 ($ 86.12) | Abandoned Baby | Sell |
| 004 14 Feb 2024 | Sell Price: 86.04 | Profit: Open Day2 ($ 85.84) | Dark Cloud Cover | Sell |
| 005 17 Nov 2023 | Sell Price: 66.90 | Profit: Open Day1 ($ 66.56) | Engulfing | Sell |
| 006 24 Oct 2023 | Buy Price: 70.49 | Loss: Close Day2 ($ 62.78) | Engulfing | Buy |
| 007 07 Sep 2023 | Sell Price: 76.09 | Profit: Open Day1 ($ 76.00) | Engulfing | Sell |
| 008 07 Aug 2023 | Buy Price: 79.84 | Loss: Close Day2 ($ 77.97) | Abandoned Baby | Buy |
| 009One Year Average | Both Sides Result for 8 Signals |
Loss: $ -10.12 ($ -1.27 / Signal) |
All of Them | Buy + Sell |
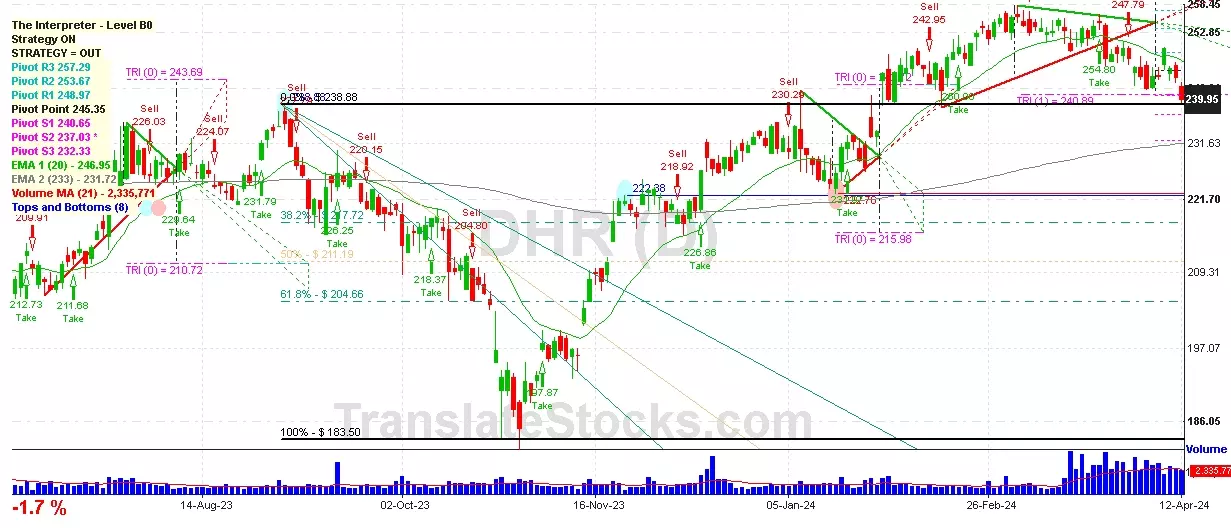
| Simple Moving Averages (SMA) Period | Value $ | Signal | Exponential Moving Averages (EMA) Period | Value $ | Signal | |
|---|---|---|---|---|---|---|
| 2 | 87.22 | SELL | 2 | 86.98 | SELL | |
| 3 | 87.68 | SELL | 3 | 87.21 | SELL | |
| 5 | 87.55 | SELL | 5 | 87.42 | SELL | |
| 8 | 87.17 | SELL | 8 | 87.79 | SELL | |
| 13 | 88.45 | SELL | 13 | 88.51 | SELL | |
| 21 | 90.30 | SELL | 21 | 89.27 | SELL | |
| 34 | 91.38 | SELL | 34 | 89.33 | SELL | |
| 55 | 89.72 | SELL | 55 | 88.01 | SELL | |
| 90 | 84.50 | BUY | 90 | 85.46 | BUY | |
| 200 | 78.65 | BUY | 200 | 82.28 | BUY |
Edwards Lifesciences Corp
IPO: 2000-03-27
Ticker: EWIndices: S&P 500,
Exchange: New York Stock Exchange, Inc. (US - USD)
Website: https://www.edwards.com
Phone:
Common Stock
Life Sciences (
Orthopedic, Prosthetic & Surgical Appliances & Supplies

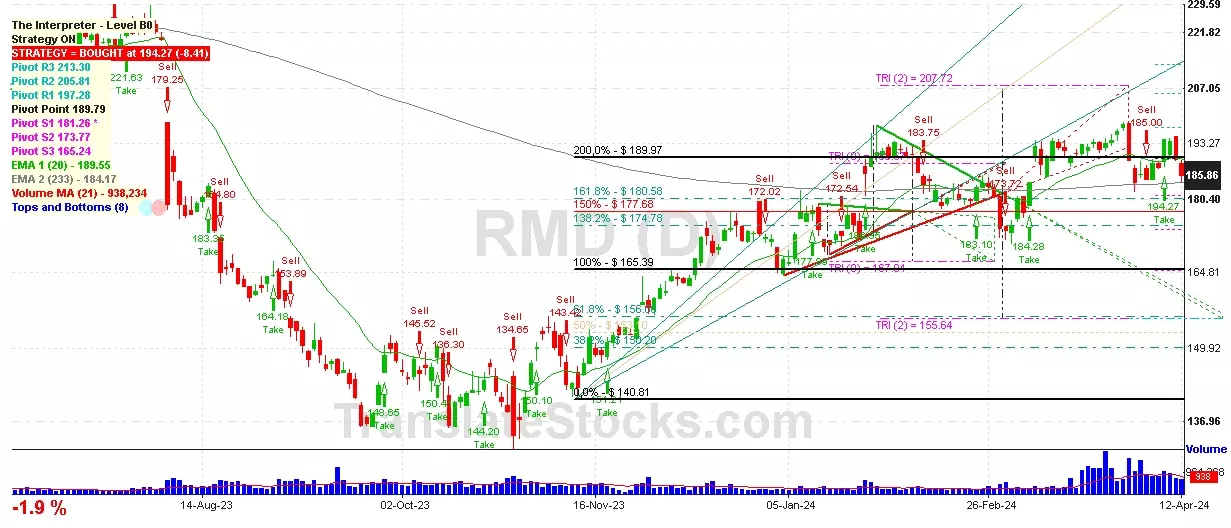
 Click to Enlarge