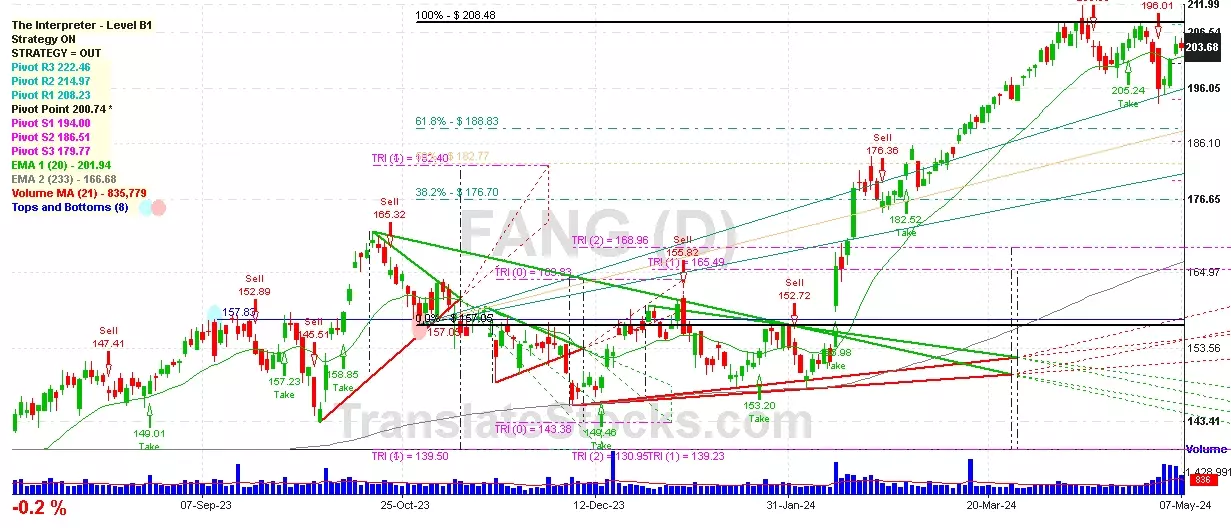
Hey Friend, I'm analysing DIAMONDBACK ENERGY INC (FANG), and it is between the Support of $ 200.74 (Pivot) and the Resistance of $ 208.23 (PivotR1). The stock is also approaching the line of Pivot at $ 200.74, and if it goes below this line it could reach the next Support of 61.8% of Fibonacci at $ 188.83.

| Date | Price $ | Result % | Candle Name | Side |
|---|---|---|---|---|
| 001 16 Jan 2024 | Sell Price: 151.16 | Profit: Open Day1 ($ 149.39) | Abandoned Baby | Sell |
| 002 24 Nov 2023 | Buy Price: 154.63 | Loss: Close Day2 ($ 153.99) | Abandoned Baby | Buy |
| 003 05 Jun 2023 | Sell Price: 130.32 | Profit: Open Day1 ($ 128.00) | Engulfing | Sell |
| 004 05 Jun 2023 | Sell Price: 130.38 | Profit: Open Day1 ($ 128.00) | Dark Cloud Cover | Sell |
| 005 12 May 2023 | Buy Price: 128.00 | Profit: Open Day1 ($ 128.71) | Abandoned Baby | Buy |
| 006One Year Average | Both Sides Result for 5 Signals |
Profit: $ 6.54 ($ 1.31 / Signal) |
All of Them | Buy + Sell |
| Simple Moving Averages (SMA) Period | Value $ | Signal | Exponential Moving Averages (EMA) Period | Value $ | Signal | |
|---|---|---|---|---|---|---|
| 2 | 202.85 | BUY | 2 | 202.89 | BUY | |
| 3 | 201.11 | BUY | 3 | 202.16 | BUY | |
| 5 | 200.09 | BUY | 5 | 201.82 | BUY | |
| 8 | 202.65 | BUY | 8 | 202.03 | BUY | |
| 13 | 202.59 | BUY | 13 | 202.27 | BUY | |
| 21 | 203.67 | BUY | 21 | 201.61 | BUY | |
| 34 | 201.34 | BUY | 34 | 198.70 | BUY | |
| 55 | 194.01 | BUY | 55 | 192.84 | BUY | |
| 90 | 179.01 | BUY | 90 | 184.58 | BUY | |
| 200 | 165.26 | BUY | 200 | 169.39 | BUY |
Diamondback Energy Inc
IPO: 2012-10-12
Ticker: FANGIndices: S&P 500,
Exchange: Nasdaq Nms - Global Market (US - USD)
Website: https://ir.diamondbackenergy.com/
Phone:
Common Stock
Energy & Transportation (
Crude Petroleum & Natural Gas
 Click to Enlarge