| Date | Price $ | Result % | Candle Name | Side |
|---|---|---|---|---|
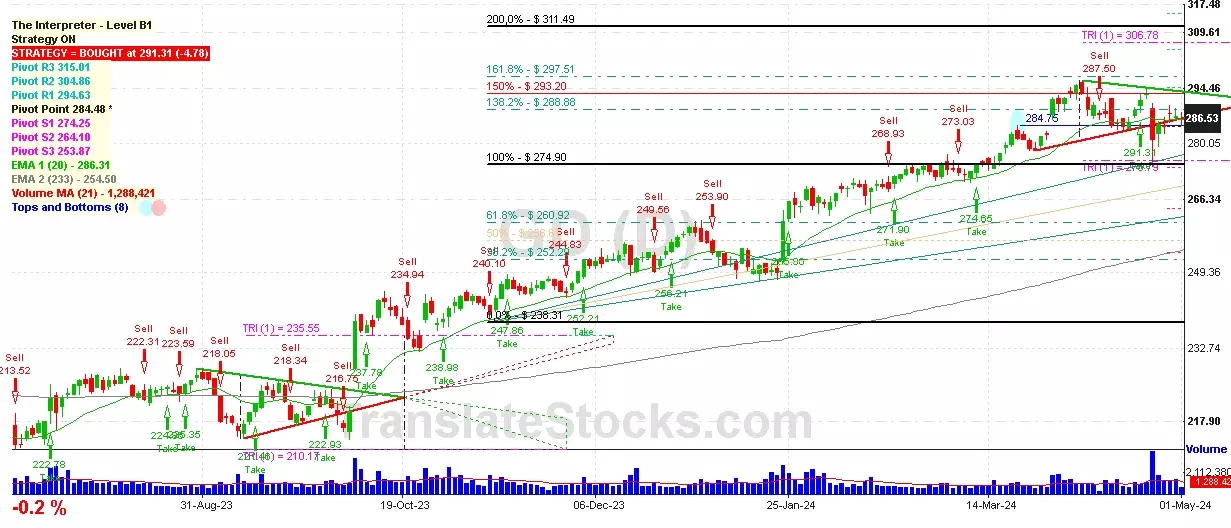
| 001 01 Apr 2024 | Sell Price: 287.60 | Profit: Close Day1 ($ 287.47) | Engulfing | Sell |
| 002 15 Mar 2024 | Buy Price: 289.02 | Profit: Open Day1 ($ 289.42) | Engulfing | Buy |
| 003 15 Mar 2024 | Buy Price: 288.29 | Profit: Open Day1 ($ 289.42) | Piercing Line | Buy |
| 004 06 Feb 2024 | Buy Price: 266.22 | Profit: Open Day1 ($ 266.62) | Piercing Line | Buy |
| 005 31 Jan 2024 | Sell Price: 258.92 | Loss: Close Day2 ($ 268.50) | Dark Cloud Cover | Sell |
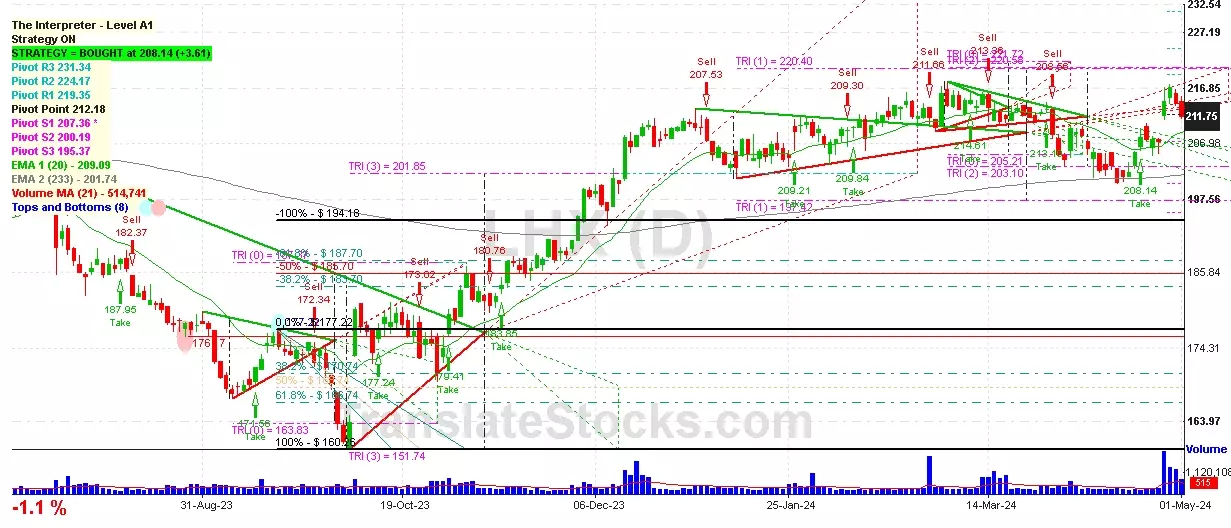
| 006 29 Sep 2023 | Sell Price: 204.91 | Profit: Open Day1 ($ 204.34) | Engulfing | Sell |
| 007 29 Sep 2023 | Sell Price: 204.58 | Profit: Open Day1 ($ 204.34) | Dark Cloud Cover | Sell |
| 008 13 Sep 2023 | Sell Price: 209.52 | Loss: Close Day2 ($ 211.65) | Engulfing | Sell |
| 009 25 Aug 2023 | Buy Price: 218.55 | Profit: Open Day1 ($ 218.57) | Abandoned Baby | Buy |
| 010 12 Jul 2023 | Sell Price: 229.59 | Profit: Open Day1 ($ 228.62) | Dark Cloud Cover | Sell |
| 011 26 Jun 2023 | Buy Price: 218.58 | Profit: Close Day1 ($ 221.18) | Engulfing | Buy |
| 012 20 Jun 2023 | Sell Price: 218.47 | Profit: Close Day2 ($ 217.95) | Engulfing | Sell |
| 013 14 Jun 2023 | Sell Price: 215.32 | Loss: Close Day2 ($ 221.18) | Dark Cloud Cover | Sell |
| 014 19 May 2023 | Sell Price: 200.64 | Loss: Close Day2 ($ 202.37) | Dark Cloud Cover | Sell |
| 015One Year Average | Both Sides Result for 14 Signals |
Loss: $ -12.32 ($ -0.88 / Signal) |
All of Them | Buy + Sell |
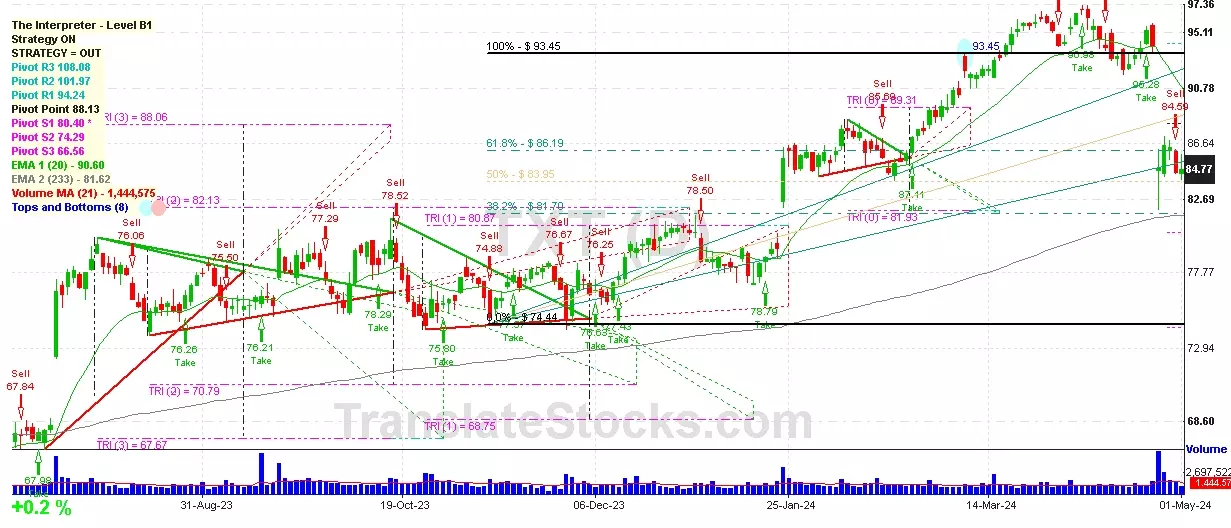
| Simple Moving Averages (SMA) Period | Value $ | Signal | Exponential Moving Averages (EMA) Period | Value $ | Signal | |
|---|---|---|---|---|---|---|
| 2 | 277.00 | BUY | 2 | 277.12 | SELL | |
| 3 | 277.51 | SELL | 3 | 277.10 | SELL | |
| 5 | 277.10 | SELL | 5 | 276.80 | BUY | |
| 8 | 276.29 | BUY | 8 | 276.42 | BUY | |
| 13 | 274.69 | BUY | 13 | 276.65 | BUY | |
| 21 | 277.05 | BUY | 21 | 277.92 | SELL | |
| 34 | 282.08 | SELL | 34 | 279.15 | SELL | |
| 55 | 284.62 | SELL | 55 | 277.92 | SELL | |
| 90 | 274.84 | BUY | 90 | 272.15 | BUY | |
| 200 | 247.51 | BUY | 200 | 255.33 | BUY |
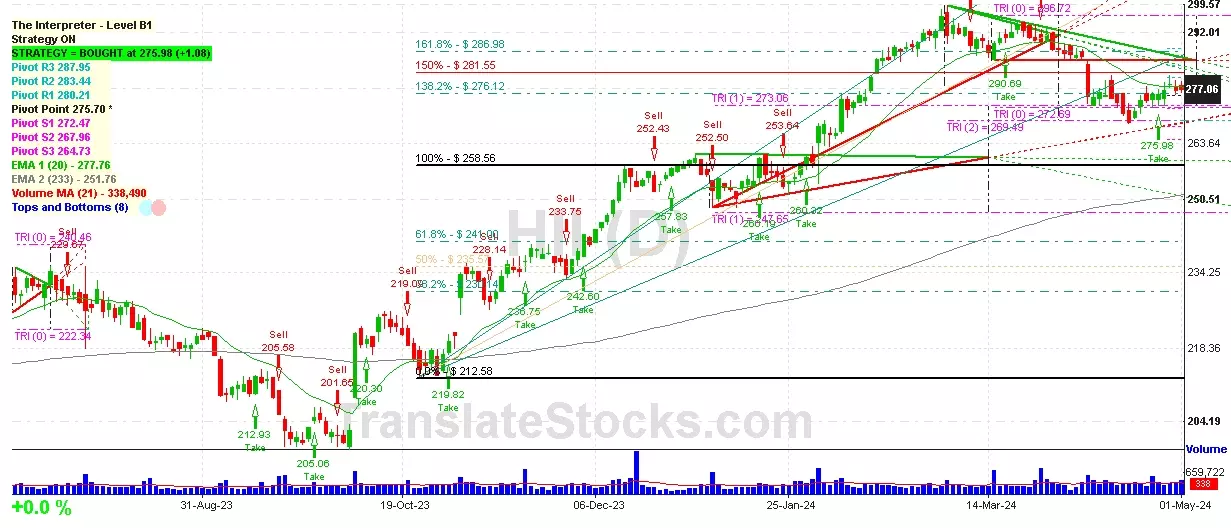
Huntington Ingalls Industrie
IPO: 2011-03-19
Ticker: HIIIndices: S&P 500,
Exchange: New York Stock Exchange, Inc. (US - USD)
Website: https://www.huntingtoningalls.com/
Phone:
Common Stock
Manufacturing (
Ship & Boat Building & Repairing

 Click to Enlarge