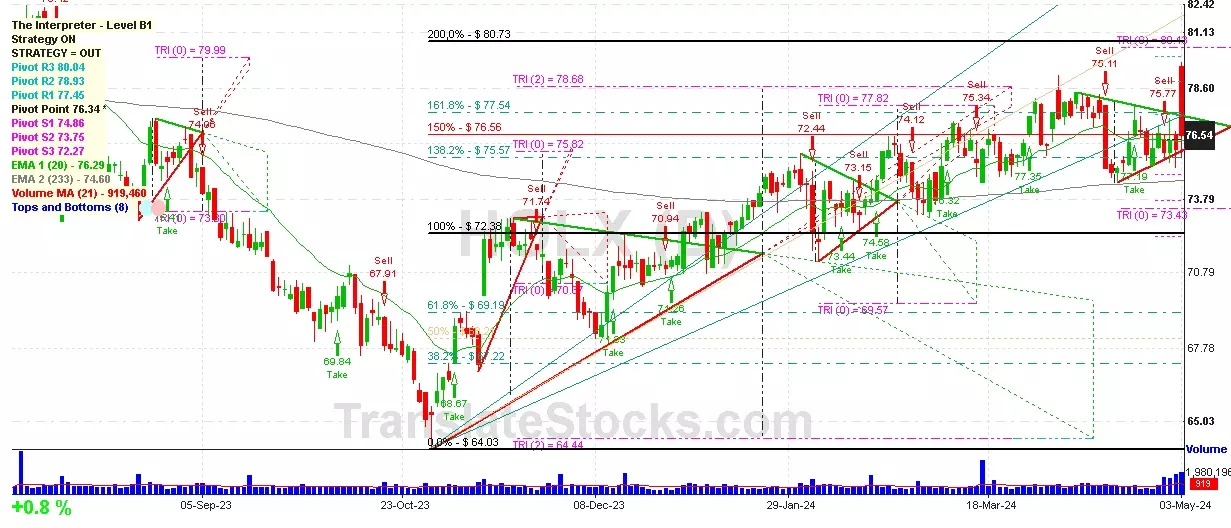
Hey Friend, I'm analysing HOLOGIC INC (HOLX), and it is between the Support of $ 76.34 (Pivot) and the Resistance of $ 76.56 (150% of Fibonacci). The stock is also approaching the line of Pivot at $ 76.34, and if it goes below this line it could reach the next Support of Triangle projection at $75.82.

| Date | Price $ | Result % | Candle Name | Side |
|---|---|---|---|---|
| 001 15 Apr 2024 | Buy Price: 77.54 | Profit: Open Day1 ($ 77.82) | Abandoned Baby | Buy |
| 002 04 Apr 2024 | Sell Price: 77.28 | Loss: Close Day2 ($ 77.38) | Dark Cloud Cover | Sell |
| 003 24 Nov 2023 | Sell Price: 71.74 | Profit: Open Day1 ($ 71.44) | Abandoned Baby | Sell |
| 004 07 Nov 2023 | Sell Price: 68.37 | Profit: Close Day1 ($ 68.27) | Abandoned Baby | Sell |
| 005 03 Oct 2023 | Buy Price: 69.30 | Profit: Open Day1 ($ 69.48) | Engulfing | Buy |
| 006 03 Oct 2023 | Buy Price: 69.28 | Profit: Open Day1 ($ 69.48) | Piercing Line | Buy |
| 007 23 Aug 2023 | Sell Price: 75.31 | Profit: Close Day1 ($ 75.17) | Engulfing | Sell |
| 008 23 May 2023 | Sell Price: 80.42 | Profit: Open Day1 ($ 80.22) | Abandoned Baby | Sell |
| 009One Year Average | Both Sides Result for 8 Signals |
Profit: $ 1.30 ($ 0.16 / Signal) |
All of Them | Buy + Sell |
| Simple Moving Averages (SMA) Period | Value $ | Signal | Exponential Moving Averages (EMA) Period | Value $ | Signal | |
|---|---|---|---|---|---|---|
| 2 | 76.23 | BUY | 2 | 76.36 | BUY | |
| 3 | 76.24 | BUY | 3 | 76.29 | BUY | |
| 5 | 76.23 | BUY | 5 | 76.24 | BUY | |
| 8 | 76.19 | BUY | 8 | 76.22 | BUY | |
| 13 | 76.03 | BUY | 13 | 76.26 | BUY | |
| 21 | 76.55 | SELL | 21 | 76.29 | BUY | |
| 34 | 76.47 | BUY | 34 | 76.17 | BUY | |
| 55 | 75.97 | BUY | 55 | 75.73 | BUY | |
| 90 | 74.86 | BUY | 90 | 75.05 | BUY | |
| 200 | 73.27 | BUY | 200 | 74.57 | BUY |
Hologic Inc
IPO: 1990-03-01
Ticker: HOLXIndices: S&P 500,
Exchange: Nasdaq Nms - Global Market (US - USD)
Website: https://www.hologic.com/
Phone:
Common Stock
Life Sciences (
X-ray Apparatus & Tubes & Related Irradiation Apparatus
 Click to Enlarge