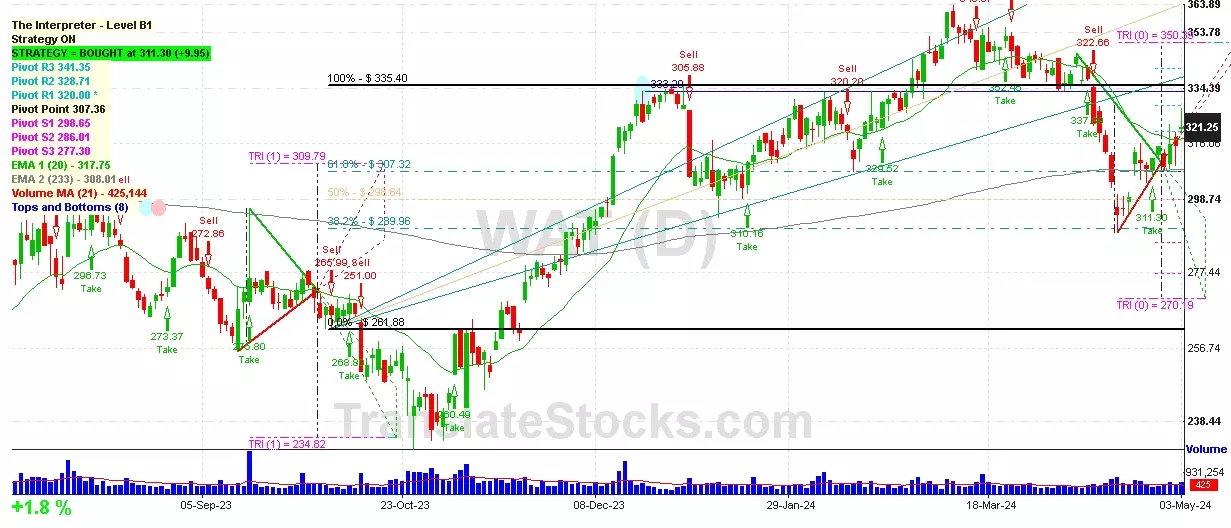
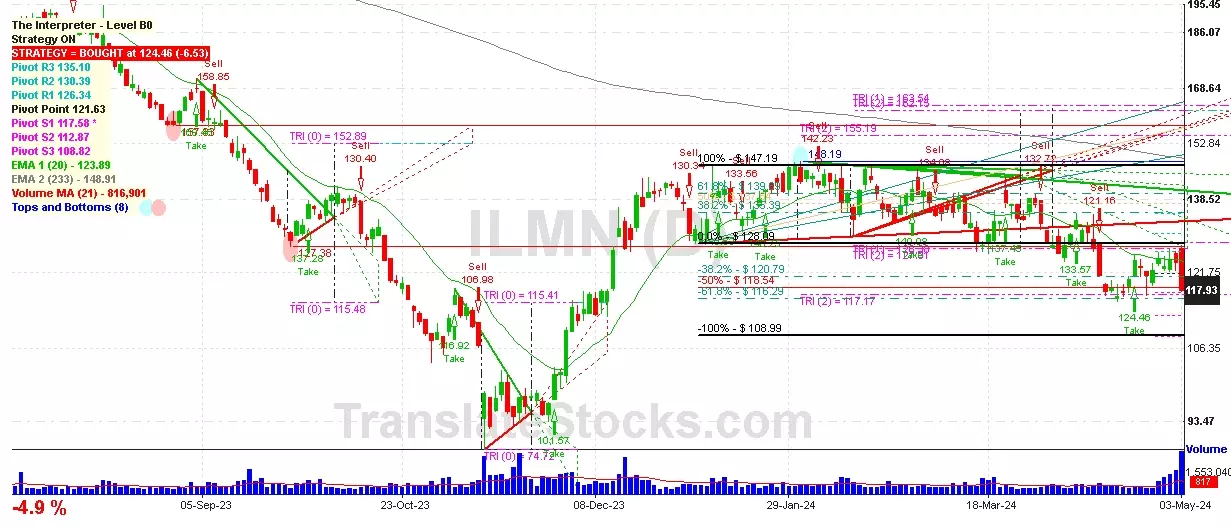
Hey Friend, I'm analysing ILLUMINA INC (ILMN), and it is between the Support of $ 117.58 (PivotS1) and the Resistance of $ 118.54 (-50% of Fibonacci). The stock is also approaching the line of PivotS1 at $ 117.58, and if it goes below this line it could reach the next Support of Triangle projection at $117.17.

| Date | Price $ | Result % | Candle Name | Side |
|---|---|---|---|---|
| 001 10 Apr 2024 | Sell Price: 131.17 | Profit: Close Day1 ($ 130.70) | Abandoned Baby | Sell |
| 002 29 Feb 2024 | Sell Price: 139.83 | Profit: Open Day1 ($ 139.20) | Dark Cloud Cover | Sell |
| 003 06 Feb 2024 | Buy Price: 144.89 | Profit: Open Day1 ($ 145.09) | Engulfing | Buy |
| 004 05 Sep 2023 | Sell Price: 159.43 | Profit: Close Day2 ($ 158.85) | Abandoned Baby | Sell |
| 005 02 Aug 2023 | Buy Price: 189.56 | Loss: Close Day2 ($ 187.67) | Piercing Line | Buy |
| 006 16 Jun 2023 | Sell Price: 205.87 | Profit: Open Day1 ($ 201.78) | Dark Cloud Cover | Sell |
| 007 13 Jun 2023 | Sell Price: 206.84 | Profit: Close Day1 ($ 204.84) | Engulfing | Sell |
| 008One Year Average | Both Sides Result for 7 Signals |
Profit: $ 6.08 ($ 0.87 / Signal) |
All of Them | Buy + Sell |
| Simple Moving Averages (SMA) Period | Value $ | Signal | Exponential Moving Averages (EMA) Period | Value $ | Signal | |
|---|---|---|---|---|---|---|
| 2 | 120.96 | SELL | 2 | 119.98 | SELL | |
| 3 | 122.20 | SELL | 3 | 120.95 | SELL | |
| 5 | 122.88 | SELL | 5 | 121.74 | SELL | |
| 8 | 122.57 | SELL | 8 | 122.12 | SELL | |
| 13 | 121.36 | SELL | 13 | 122.71 | SELL | |
| 21 | 123.66 | SELL | 21 | 124.07 | SELL | |
| 34 | 127.26 | SELL | 34 | 126.25 | SELL | |
| 55 | 130.89 | SELL | 55 | 128.49 | SELL | |
| 90 | 134.24 | SELL | 90 | 130.89 | SELL | |
| 200 | 137.05 | SELL | 200 | 143.42 | SELL |
Illumina Inc
IPO: 2000-07-28
Ticker: ILMNIndices: S&P 500,
Nasdaq 100,
Exchange: Nasdaq Nms - Global Market (US - USD)
Website: https://www.illumina.com
Phone:
Common Stock
Life Sciences (
Laboratory Analytical Instruments
 Click to Enlarge