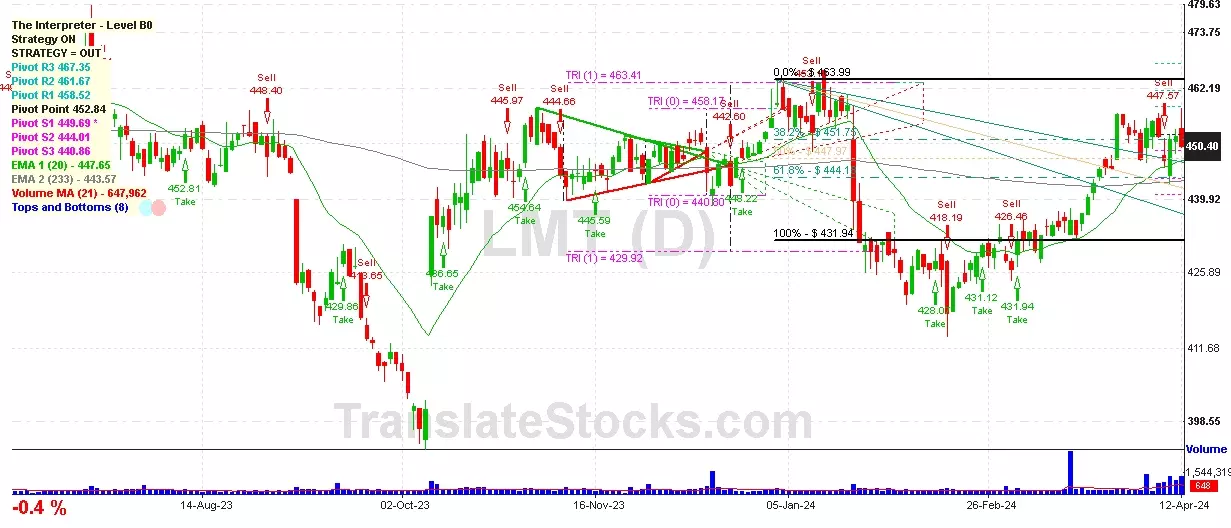
Hey Friend, I'm analysing LOCKHEED MARTIN CORP (LMT), and it is between the Support of $ 449.69 (PivotS1) and the Resistance of $ 451.75 (38.2% of Fibonacci). The stock is also approaching the line of PivotS1 at $ 449.69, and if it goes below this line it could reach the next Support of 50% of Fibonacci at $ 447.97.

| Date | Price $ | Result % | Candle Name | Side |
|---|---|---|---|---|
| 001 08 Mar 2024 | Buy Price: 432.90 | Profit: Open Day1 ($ 434.31) | Piercing Line | Buy |
| 002 04 Mar 2024 | Buy Price: 431.94 | Profit: Open Day1 ($ 433.74) | Abandoned Baby | Buy |
| 003 16 Jan 2024 | Sell Price: 457.84 | Profit: Open Day1 ($ 457.67) | Dark Cloud Cover | Sell |
| 004 04 Jan 2024 | Sell Price: 457.87 | Profit: Close Day1 ($ 456.50) | Engulfing | Sell |
| 005 18 Dec 2023 | Buy Price: 446.91 | Profit: Open Day1 ($ 447.68) | Abandoned Baby | Buy |
| 006 14 Nov 2023 | Sell Price: 444.22 | Profit: Open Day1 ($ 443.47) | Abandoned Baby | Sell |
| 007 06 Oct 2023 | Buy Price: 400.95 | Profit: Open Day1 ($ 428.72) | Engulfing | Buy |
| 008 06 Oct 2023 | Buy Price: 400.73 | Profit: Open Day1 ($ 428.72) | Piercing Line | Buy |
| 009 13 Sep 2023 | Buy Price: 420.99 | Profit: Close Day1 ($ 425.89) | Abandoned Baby | Buy |
| 010 10 Jul 2023 | Buy Price: 460.38 | Profit: Open Day1 ($ 461.27) | Engulfing | Buy |
| 011 24 May 2023 | Buy Price: 452.72 | Loss: Close Day2 ($ 448.45) | Abandoned Baby | Buy |
| 012 12 May 2023 | Buy Price: 450.79 | Profit: Close Day1 ($ 451.92) | Abandoned Baby | Buy |
| 013One Year Average | Both Sides Result for 12 Signals |
Profit: $ 64.68 ($ 5.39 / Signal) |
All of Them | Buy + Sell |
| Simple Moving Averages (SMA) Period | Value $ | Signal | Exponential Moving Averages (EMA) Period | Value $ | Signal | |
|---|---|---|---|---|---|---|
| 2 | 463.04 | SELL | 2 | 461.88 | SELL | |
| 3 | 461.74 | SELL | 3 | 461.77 | SELL | |
| 5 | 461.32 | SELL | 5 | 461.15 | BUY | |
| 8 | 460.33 | BUY | 8 | 459.96 | BUY | |
| 13 | 457.27 | BUY | 13 | 457.98 | BUY | |
| 21 | 455.36 | BUY | 21 | 454.98 | BUY | |
| 34 | 449.63 | BUY | 34 | 451.07 | BUY | |
| 55 | 441.45 | BUY | 55 | 447.49 | BUY | |
| 90 | 443.10 | BUY | 90 | 445.21 | BUY | |
| 200 | 442.35 | BUY | 200 | 445.11 | BUY |
Lockheed Martin Corp
IPO: 1961-10-11
Ticker: LMTIndices: S&P 500,
Exchange: New York Stock Exchange, Inc. (US - USD)
Website: http://www.lockheedmartin.com
Phone:
Common Stock
Manufacturing (
Guided Missiles & Space Vehicles & Parts
 Click to Enlarge