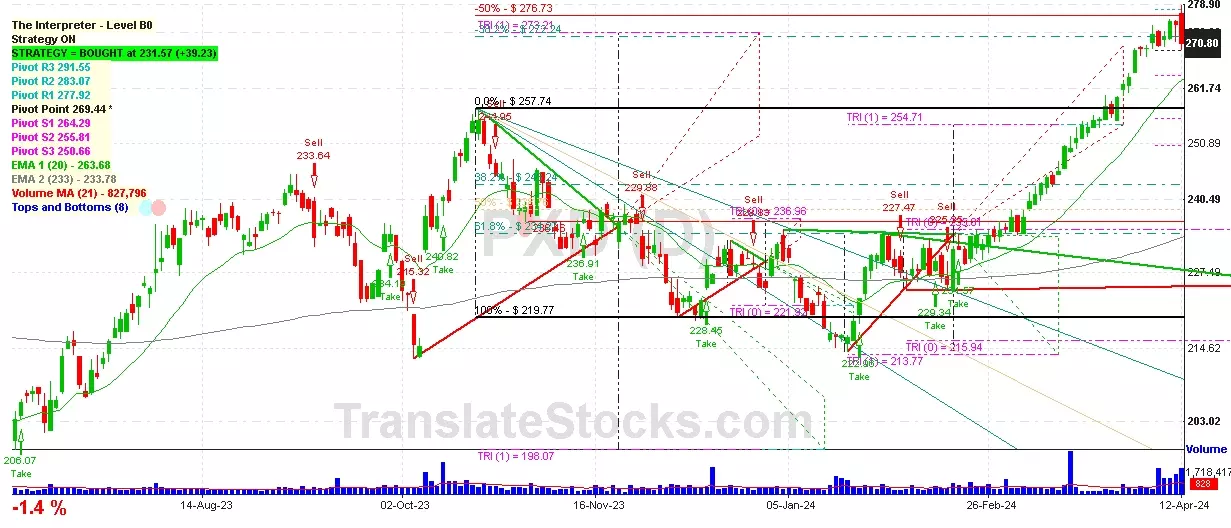
Hey Friend, I'm analysing PIONEER NATURAL RESOURCES CO (PXD), and it is between the Support of $ 269.44 (Pivot) and the Resistance of $ 272.24 (-38.2% of Fibonacci). The stock is also approaching the line of Pivot at $ 269.44, and if it goes below this line it could reach the next Support of 0% of Fibonacci at $ 257.74.

| Date | Price $ | Result % | Candle Name | Side |
|---|---|---|---|---|
| 001 08 Apr 2024 | Sell Price: 270.51 | Loss: Close Day2 ($ 275.32) | Engulfing | Sell |
| 002 04 Mar 2024 | Sell Price: 234.70 | Profit: Open Day1 ($ 234.36) | Engulfing | Sell |
| 003 31 Aug 2023 | Sell Price: 237.93 | Loss: Close Day2 ($ 243.03) | Abandoned Baby | Sell |
| 004 26 Jun 2023 | Buy Price: 201.38 | Profit: Close Day2 ($ 203.44) | Abandoned Baby | Buy |
| 005 09 Jun 2023 | Sell Price: 204.80 | Profit: Open Day1 ($ 201.30) | Abandoned Baby | Sell |
| 006 09 May 2023 | Sell Price: 211.24 | Profit: Close Day1 ($ 209.11) | Abandoned Baby | Sell |
| 007One Year Average | Both Sides Result for 6 Signals |
Loss: $ -1.88 ($ -0.31 / Signal) |
All of Them | Buy + Sell |
| Simple Moving Averages (SMA) Period | Value $ | Signal | Exponential Moving Averages (EMA) Period | Value $ | Signal | |
|---|---|---|---|---|---|---|
| 2 | 272.01 | SELL | 2 | 270.96 | SELL | |
| 3 | 273.18 | SELL | 3 | 271.83 | SELL | |
| 5 | 273.66 | SELL | 5 | 272.24 | SELL | |
| 8 | 271.79 | SELL | 8 | 272.02 | SELL | |
| 13 | 271.65 | SELL | 13 | 271.00 | SELL | |
| 21 | 270.60 | SELL | 21 | 268.31 | BUY | |
| 34 | 263.62 | BUY | 34 | 263.17 | BUY | |
| 55 | 252.14 | BUY | 55 | 256.28 | BUY | |
| 90 | 241.96 | BUY | 90 | 249.04 | BUY | |
| 200 | 236.84 | BUY | 200 | 238.78 | BUY |
Pioneer Natural Resources Co
IPO: 1993-01-13
Ticker: PXDIndices: S&P 500,
Exchange: New York Stock Exchange, Inc. (US - USD)
Website: http://www.pxd.com/
Phone:
Common Stock
Energy & Transportation (
Crude Petroleum & Natural Gas
 Click to Enlarge