| Date | Price $ | Result % | Candle Name | Side |
|---|---|---|---|---|
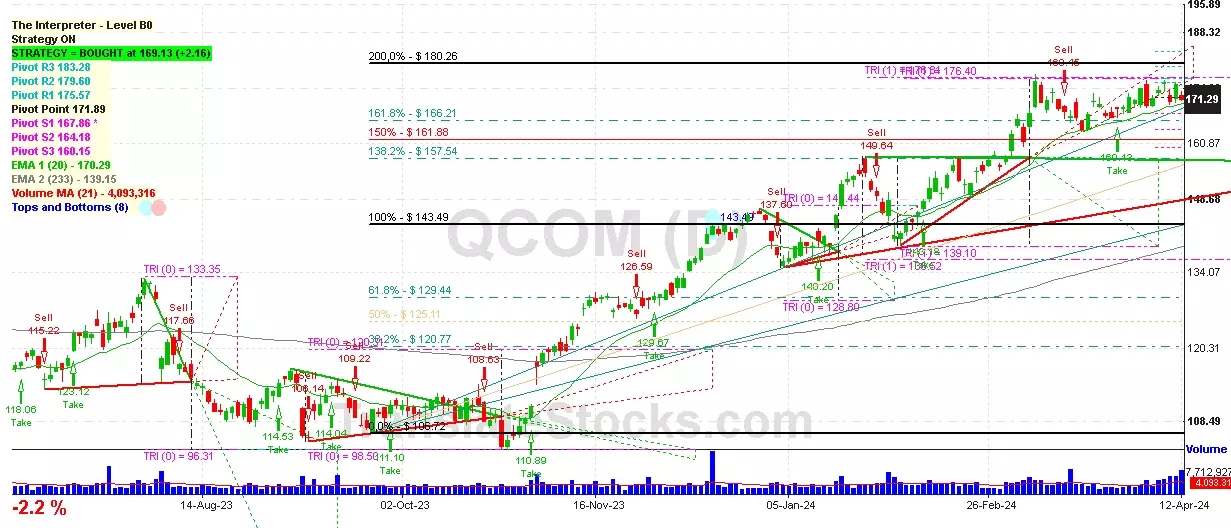
| 001 04 Apr 2024 | Sell Price: 169.76 | Loss: Close Day2 ($ 173.62) | Engulfing | Sell |
| 002 18 Jan 2024 | Buy Price: 145.29 | Profit: Open Day1 ($ 147.27) | Abandoned Baby | Buy |
| 003 29 Dec 2023 | Sell Price: 144.63 | Profit: Open Day1 ($ 142.19) | Abandoned Baby | Sell |
| 004 29 Nov 2023 | Buy Price: 127.91 | Profit: Open Day1 ($ 129.27) | Abandoned Baby | Buy |
| 005 26 Jun 2023 | Buy Price: 116.63 | Profit: Open Day1 ($ 116.74) | Abandoned Baby | Buy |
| 006 16 Jun 2023 | Sell Price: 122.68 | Profit: Open Day1 ($ 121.94) | Dark Cloud Cover | Sell |
| 007 31 May 2023 | Sell Price: 113.41 | Loss: Close Day2 ($ 115.62) | Abandoned Baby | Sell |
| 008One Year Average | Both Sides Result for 7 Signals |
Profit: $ 0.55 ($ 0.08 / Signal) |
All of Them | Buy + Sell |
| Simple Moving Averages (SMA) Period | Value $ | Signal | Exponential Moving Averages (EMA) Period | Value $ | Signal | |
|---|---|---|---|---|---|---|
| 2 | 164.48 | BUY | 2 | 164.81 | BUY | |
| 3 | 164.20 | BUY | 3 | 164.23 | BUY | |
| 5 | 162.82 | BUY | 5 | 163.74 | BUY | |
| 8 | 162.19 | BUY | 8 | 164.04 | BUY | |
| 13 | 165.63 | BUY | 13 | 165.06 | BUY | |
| 21 | 168.08 | SELL | 21 | 165.93 | SELL | |
| 34 | 168.30 | SELL | 34 | 165.44 | BUY | |
| 55 | 164.27 | BUY | 55 | 162.41 | BUY | |
| 90 | 156.45 | BUY | 90 | 156.23 | BUY | |
| 200 | 135.39 | BUY | 200 | 143.19 | BUY |
Qualcomm Inc
IPO: 1991-12-01
Ticker: QCOMIndices: S&P 500,
Nasdaq 100,
Exchange: Nasdaq Nms - Global Market (US - USD)
Website: https://www.qualcomm.com/
Phone:
Common Stock
Manufacturing (
Radio & Tv Broadcasting & Communications Equipment
 Click to Enlarge