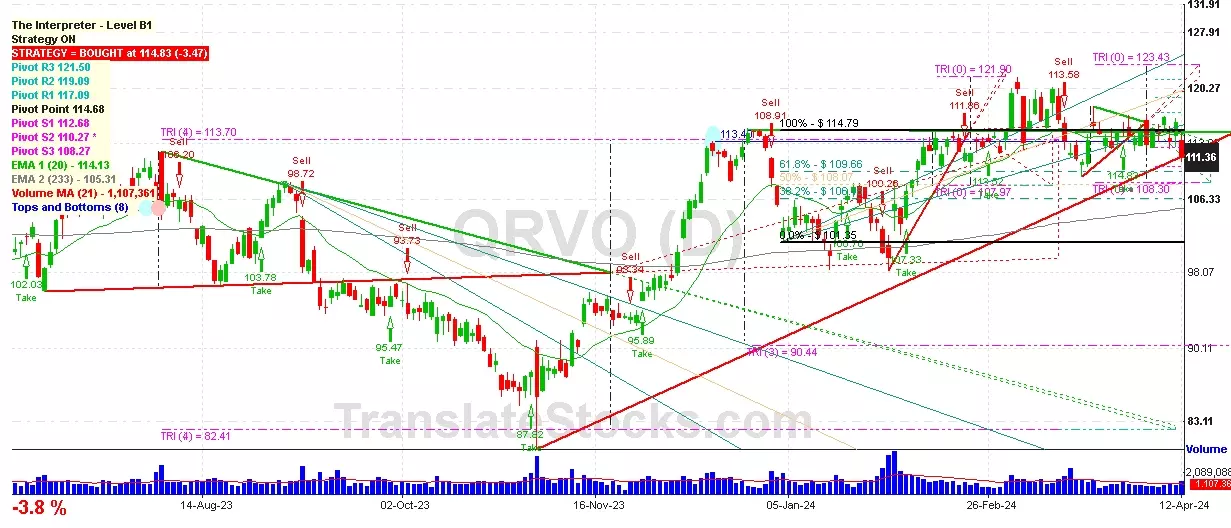
Hey Friend, I'm analysing QORVO INC (QRVO), and it is between the Support of $ 110.27 (PivotS2) and the Resistance of $ 112.68 (PivotS1). The stock is also approaching the line of PivotS2 at $ 110.27, and if it goes below this line it could reach the next Support of 61.8% of Fibonacci at $ 109.66.

| Date | Price $ | Result % | Candle Name | Side |
|---|---|---|---|---|
| 001 10 Apr 2024 | Sell Price: 113.38 | Profit: Close Day2 ($ 111.36) | Abandoned Baby | Sell |
| 002 08 Mar 2024 | Sell Price: 116.07 | Profit: Open Day1 ($ 115.22) | Engulfing | Sell |
| 003 28 Feb 2024 | Sell Price: 112.05 | Loss: Close Day2 ($ 119.62) | Abandoned Baby | Sell |
| 004 14 Feb 2024 | Buy Price: 113.59 | Profit: Open Day1 ($ 114.00) | Abandoned Baby | Buy |
| 005 19 Sep 2023 | Sell Price: 95.65 | Profit: Close Day1 ($ 95.21) | Engulfing | Sell |
| 006 06 Jun 2023 | Buy Price: 96.87 | Profit: Open Day1 ($ 97.50) | Piercing Line | Buy |
| 007 08 May 2023 | Buy Price: 94.17 | Profit: Open Day2 ($ 94.33) | Engulfing | Buy |
| 008 08 May 2023 | Buy Price: 94.22 | Profit: Open Day2 ($ 94.33) | Piercing Line | Buy |
| 009One Year Average | Both Sides Result for 8 Signals |
Loss: $ -2.95 ($ -0.37 / Signal) |
All of Them | Buy + Sell |
| Simple Moving Averages (SMA) Period | Value $ | Signal | Exponential Moving Averages (EMA) Period | Value $ | Signal | |
|---|---|---|---|---|---|---|
| 2 | 115.73 | BUY | 2 | 115.61 | BUY | |
| 3 | 114.53 | BUY | 3 | 114.51 | BUY | |
| 5 | 111.74 | BUY | 5 | 113.02 | BUY | |
| 8 | 110.17 | BUY | 8 | 112.08 | BUY | |
| 13 | 111.01 | BUY | 13 | 111.83 | BUY | |
| 21 | 112.37 | BUY | 21 | 112.08 | BUY | |
| 34 | 113.10 | BUY | 34 | 112.27 | BUY | |
| 55 | 113.52 | BUY | 55 | 111.67 | BUY | |
| 90 | 110.85 | BUY | 90 | 109.86 | BUY | |
| 200 | 103.84 | BUY | 200 | 105.96 | BUY |
Qorvo Inc
IPO: 1997-06-03
Ticker: QRVOIndices: S&P 500,
Exchange: Nasdaq Nms - Global Market (US - USD)
Website: https://www.qorvo.com/
Phone:
Common Stock
Manufacturing (
Semiconductors & Related Devices
 Click to Enlarge