| Date | Price $ | Result % | Candle Name | Side |
|---|---|---|---|---|
| 001 04 Apr 2024 | Sell Price: 185.00 | Loss: Close Day2 ($ 187.76) | Engulfing | Sell |
| 002 01 Apr 2024 | Sell Price: 189.32 | Profit: Open Day1 ($ 187.59) | Engulfing | Sell |
| 003 22 Feb 2024 | Buy Price: 183.10 | Profit: Close Day1 ($ 184.04) | Engulfing | Buy |
| 004 01 Dec 2023 | Buy Price: 159.64 | Profit: Open Day1 ($ 160.84) | Engulfing | Buy |
| 005 01 Dec 2023 | Buy Price: 159.44 | Profit: Open Day1 ($ 160.84) | Piercing Line | Buy |
| 006 28 Nov 2023 | Buy Price: 155.68 | Profit: Open Day1 ($ 158.50) | Engulfing | Buy |
| 007 04 Oct 2023 | Buy Price: 148.01 | Loss: Close Day2 ($ 146.59) | Abandoned Baby | Buy |
| 008 14 Sep 2023 | Buy Price: 147.64 | Profit: Open Day1 ($ 147.96) | Abandoned Baby | Buy |
| 009 25 Jul 2023 | Buy Price: 219.99 | Profit: Open Day1 ($ 221.00) | Engulfing | Buy |
| 010 03 Jul 2023 | Sell Price: 214.65 | Profit: Open Day1 ($ 214.08) | Abandoned Baby | Sell |
| 011 08 May 2023 | Buy Price: 233.03 | Profit: Close Day2 ($ 233.50) | Engulfing | Buy |
| 012 08 May 2023 | Buy Price: 232.70 | Profit: Close Day2 ($ 233.50) | Piercing Line | Buy |
| 013One Year Average | Both Sides Result for 12 Signals |
Profit: $ 7.09 ($ 0.59 / Signal) |
All of Them | Buy + Sell |
| Simple Moving Averages (SMA) Period | Value $ | Signal | Exponential Moving Averages (EMA) Period | Value $ | Signal | |
|---|---|---|---|---|---|---|
| 2 | 214.50 | BUY | 2 | 214.63 | BUY | |
| 3 | 215.40 | SELL | 3 | 213.23 | BUY | |
| 5 | 209.53 | BUY | 5 | 209.02 | BUY | |
| 8 | 199.50 | BUY | 8 | 203.66 | BUY | |
| 13 | 192.02 | BUY | 13 | 198.49 | BUY | |
| 21 | 190.82 | BUY | 21 | 194.74 | BUY | |
| 34 | 191.37 | BUY | 34 | 191.84 | BUY | |
| 55 | 188.07 | BUY | 55 | 188.59 | BUY | |
| 90 | 184.40 | BUY | 90 | 184.51 | BUY | |
| 200 | 172.27 | BUY | 200 | 183.42 | BUY |
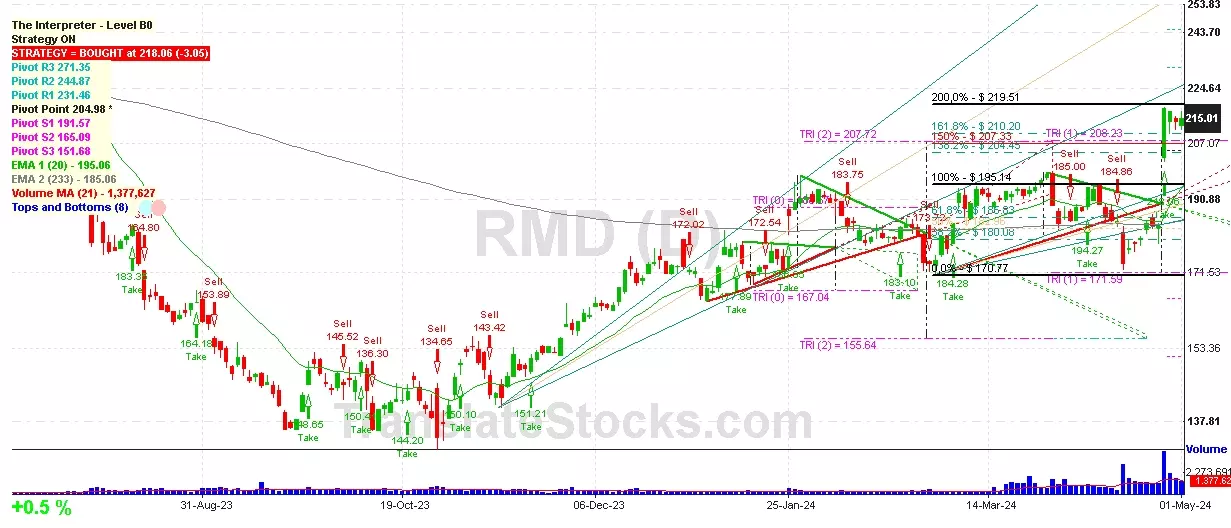
Resmed Inc
IPO: 1995-06-01
Ticker: RMDIndices: S&P 500,
Exchange: New York Stock Exchange, Inc. (US - USD)
Website: https://www.resmed.com/
Phone:
Common Stock
Life Sciences (
Surgical & Medical Instruments & Apparatus

 Click to Enlarge