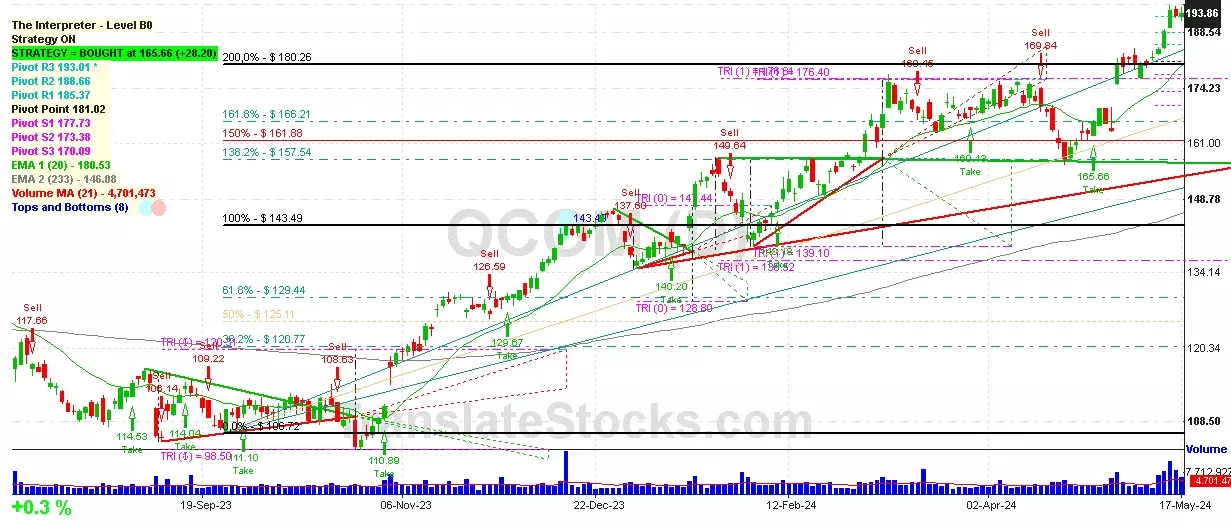
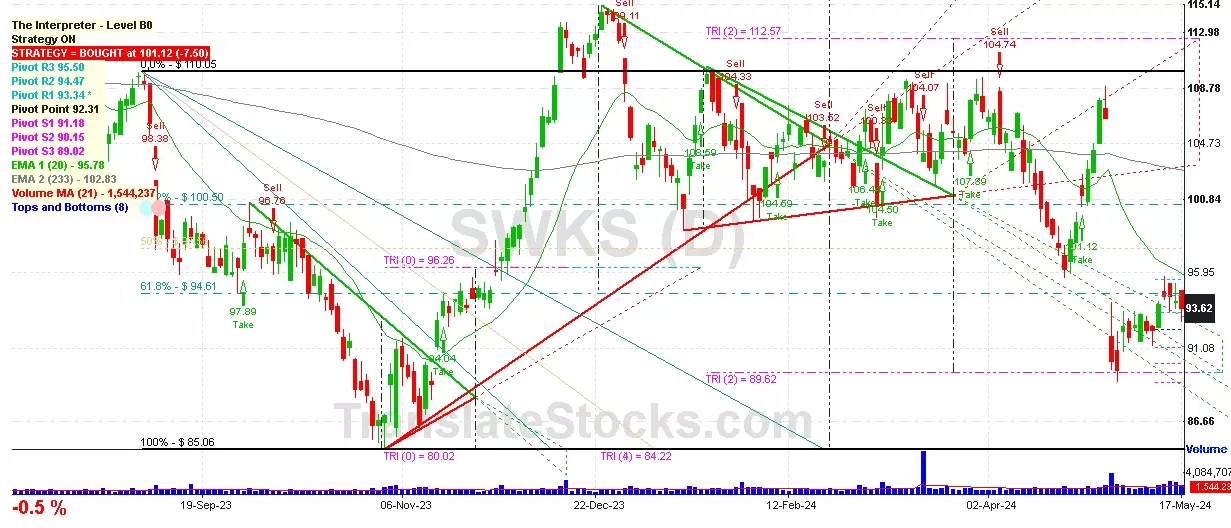
Hey Friend, I'm analysing SKYWORKS SOLUTIONS INC (SWKS), and it is between the Support of $ 93.34 (PivotR1) and the Resistance of $ 94.47 (PivotR2). The stock is also approaching the line of PivotR1 at $ 93.34, and if it goes below this line it could reach the next Support of Triangle projection at $89.62.

| Date | Price $ | Result % | Candle Name | Side |
|---|---|---|---|---|
| 001 06 May 2024 | Sell Price: 91.78 | Profit: Open Day2 ($ 91.75) | Engulfing | Sell |
| 002 09 Apr 2024 | Buy Price: 106.90 | Loss: Close Day2 ($ 104.33) | Abandoned Baby | Buy |
| 003 04 Apr 2024 | Sell Price: 104.74 | Profit: Open Day2 ($ 102.82) | Engulfing | Sell |
| 004 04 Apr 2024 | Sell Price: 105.16 | Profit: Open Day1 ($ 104.86) | Dark Cloud Cover | Sell |
| 005 24 Jan 2024 | Sell Price: 107.80 | Profit: Close Day1 ($ 107.03) | Engulfing | Sell |
| 006 05 Jan 2024 | Buy Price: 103.27 | Profit: Open Day1 ($ 103.64) | Abandoned Baby | Buy |
| 007 05 Sep 2023 | Sell Price: 109.13 | Profit: Open Day1 ($ 109.12) | Abandoned Baby | Sell |
| 008 24 Jul 2023 | Sell Price: 112.59 | Profit: Open Day2 ($ 111.64) | Engulfing | Sell |
| 009 14 Jul 2023 | Sell Price: 111.75 | Profit: Open Day1 ($ 111.50) | Abandoned Baby | Sell |
| 010 15 Jun 2023 | Sell Price: 109.57 | Profit: Close Day1 ($ 109.26) | Abandoned Baby | Sell |
| 011One Year Average | Both Sides Result for 10 Signals |
Profit: $ 2.34 ($ 0.23 / Signal) |
All of Them | Buy + Sell |
| Simple Moving Averages (SMA) Period | Value $ | Signal | Exponential Moving Averages (EMA) Period | Value $ | Signal | |
|---|---|---|---|---|---|---|
| 2 | 93.86 | SELL | 2 | 93.80 | SELL | |
| 3 | 94.03 | SELL | 3 | 93.85 | SELL | |
| 5 | 94.08 | SELL | 5 | 93.82 | SELL | |
| 8 | 93.51 | BUY | 8 | 93.93 | SELL | |
| 13 | 92.69 | BUY | 13 | 94.60 | SELL | |
| 21 | 96.25 | SELL | 21 | 95.94 | SELL | |
| 34 | 98.83 | SELL | 34 | 97.77 | SELL | |
| 55 | 101.46 | SELL | 55 | 99.56 | SELL | |
| 90 | 102.58 | SELL | 90 | 100.85 | SELL | |
| 200 | 101.29 | SELL | 200 | 102.23 | SELL |
Skyworks Solutions Inc
IPO: 2002-07-03
Ticker: SWKSIndices: S&P 500,
Nasdaq 100,
Exchange: Nasdaq Nms - Global Market (US - USD)
Website: https://www.skyworksinc.com/
Phone:
Common Stock
Manufacturing (
Semiconductors & Related Devices
 Click to Enlarge