| Date | Price $ | Result % | Candle Name | Side |
|---|---|---|---|---|
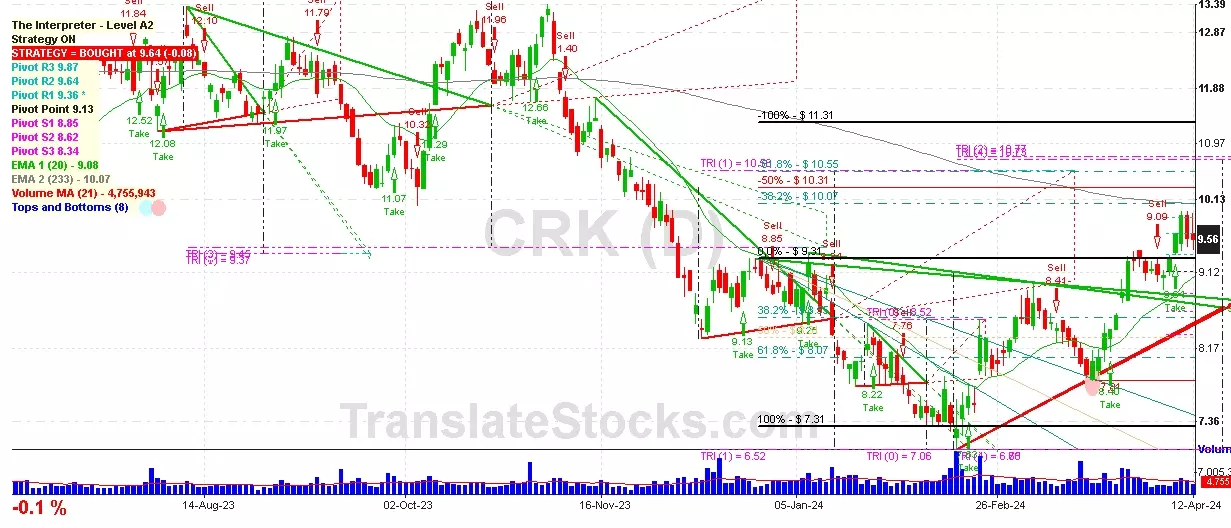
| 001 02 Apr 2024 | Sell Price: 9.12 | Profit: Close Day2 ($ 9.09) | Abandoned Baby | Sell |
| 002 13 Dec 2023 | Buy Price: 8.68 | Profit: Open Day1 ($ 8.88) | Abandoned Baby | Buy |
| 003 13 Dec 2023 | Buy Price: 8.69 | Profit: Open Day1 ($ 8.88) | Engulfing | Buy |
| 004 31 Oct 2023 | Buy Price: 12.60 | Profit: Close Day1 ($ 12.66) | Engulfing | Buy |
| 005 22 Aug 2023 | Sell Price: 11.84 | Profit: Open Day1 ($ 11.66) | Engulfing | Sell |
| 006 26 Jul 2023 | Buy Price: 12.21 | Profit: Open Day1 ($ 12.44) | Engulfing | Buy |
| 007 02 Jun 2023 | Buy Price: 9.71 | Profit: Open Day1 ($ 9.98) | Abandoned Baby | Buy |
| 008 09 May 2023 | Sell Price: 9.70 | Profit: Close Day1 ($ 9.55) | Abandoned Baby | Sell |
| 009One Year Average | Both Sides Result for 8 Signals |
Profit: $ 1.31 ($ 0.16 / Signal) |
All of Them | Buy + Sell |
| Simple Moving Averages (SMA) Period | Value $ | Signal | Exponential Moving Averages (EMA) Period | Value $ | Signal | |
|---|---|---|---|---|---|---|
| 2 | 10.23 | BUY | 2 | 10.20 | BUY | |
| 3 | 10.08 | BUY | 3 | 10.10 | BUY | |
| 5 | 9.90 | BUY | 5 | 9.95 | BUY | |
| 8 | 9.63 | BUY | 8 | 9.79 | BUY | |
| 13 | 9.61 | BUY | 13 | 9.63 | BUY | |
| 21 | 9.46 | BUY | 21 | 9.42 | BUY | |
| 34 | 9.02 | BUY | 34 | 9.17 | BUY | |
| 55 | 8.62 | BUY | 55 | 9.00 | BUY | |
| 90 | 8.57 | BUY | 90 | 9.08 | BUY | |
| 200 | 10.18 | BUY | 200 | 9.84 | BUY |
Comstock Resources Inc
IPO: 1996-12-17
Ticker: CRKIndices: S&P 500,
Exchange: New York Stock Exchange, Inc. (US - USD)
Website: http://www.comstockresources.com/
Phone:
Common Stock
Energy & Transportation (
Crude Petroleum & Natural Gas

 Click to Enlarge