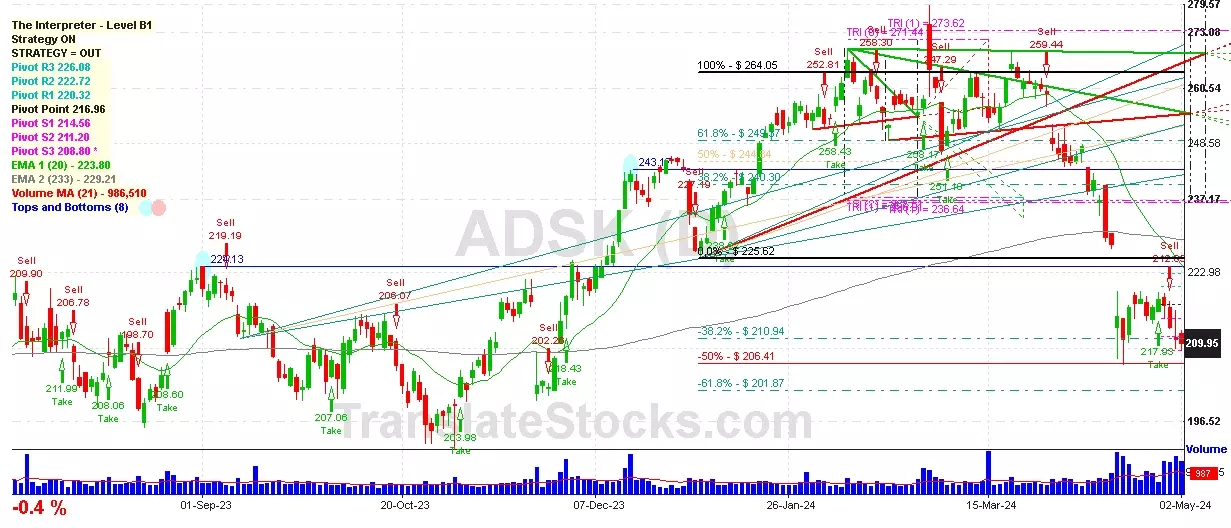
Hey Friend, I'm analysing AUTODESK INC (ADSK), and it is between the Support of $ 208.80 (PivotS3) and the Resistance of $ 210.94 (-38.2% of Fibonacci). The stock is also approaching the line of PivotS3 at $ 208.80, and if it goes below this line it could reach the next Support of -50% of Fibonacci at $ 206.41.

| Date | Price $ | Result % | Candle Name | Side |
|---|---|---|---|---|
| 001 26 Mar 2024 | Buy Price: 261.67 | Loss: Close Day2 ($ 260.42) | Abandoned Baby | Buy |
| 002 13 Mar 2024 | Sell Price: 258.70 | Profit: Open Day1 ($ 258.56) | Engulfing | Sell |
| 003 04 Mar 2024 | Sell Price: 260.70 | Profit: Open Day1 ($ 257.35) | Abandoned Baby | Sell |
| 004 29 Feb 2024 | Buy Price: 258.17 | Profit: Open Day1 ($ 275.00) | Abandoned Baby | Buy |
| 005 14 Feb 2024 | Buy Price: 262.17 | Profit: Open Day1 ($ 264.74) | Abandoned Baby | Buy |
| 006 01 Feb 2024 | Buy Price: 255.07 | Profit: Close Day1 ($ 256.45) | Engulfing | Buy |
| 007 18 Jan 2024 | Buy Price: 241.18 | Profit: Open Day1 ($ 242.37) | Engulfing | Buy |
| 008 16 Jan 2024 | Sell Price: 241.50 | Profit: Open Day1 ($ 239.66) | Abandoned Baby | Sell |
| 009 18 Dec 2023 | Sell Price: 239.14 | Profit: Close Day1 ($ 238.16) | Abandoned Baby | Sell |
| 010 01 Sep 2023 | Sell Price: 220.02 | Profit: Open Day1 ($ 218.09) | Engulfing | Sell |
| 011 29 Jun 2023 | Sell Price: 206.18 | Profit: Close Day1 ($ 204.61) | Dark Cloud Cover | Sell |
| 012One Year Average | Both Sides Result for 11 Signals |
Profit: $ 30.53 ($ 2.78 / Signal) |
All of Them | Buy + Sell |
| Simple Moving Averages (SMA) Period | Value $ | Signal | Exponential Moving Averages (EMA) Period | Value $ | Signal | |
|---|---|---|---|---|---|---|
| 2 | 210.33 | SELL | 2 | 210.59 | SELL | |
| 3 | 211.17 | SELL | 3 | 211.37 | SELL | |
| 5 | 213.64 | SELL | 5 | 212.69 | SELL | |
| 8 | 214.69 | SELL | 8 | 214.61 | SELL | |
| 13 | 215.77 | SELL | 13 | 218.43 | SELL | |
| 21 | 225.48 | SELL | 21 | 224.50 | SELL | |
| 34 | 237.97 | SELL | 34 | 231.56 | SELL | |
| 55 | 245.27 | SELL | 55 | 236.84 | SELL | |
| 90 | 246.07 | SELL | 90 | 237.84 | SELL | |
| 200 | 227.30 | SELL | 200 | 230.62 | SELL |
Autodesk Inc
IPO: 1985-05-01
Ticker: ADSKIndices: S&P 500,
Nasdaq 100,
Exchange: Nasdaq Nms - Global Market (US - USD)
Website: https://www.autodesk.com/
Phone:
Common Stock
Technology (
Services-prepackaged Software
 Click to Enlarge