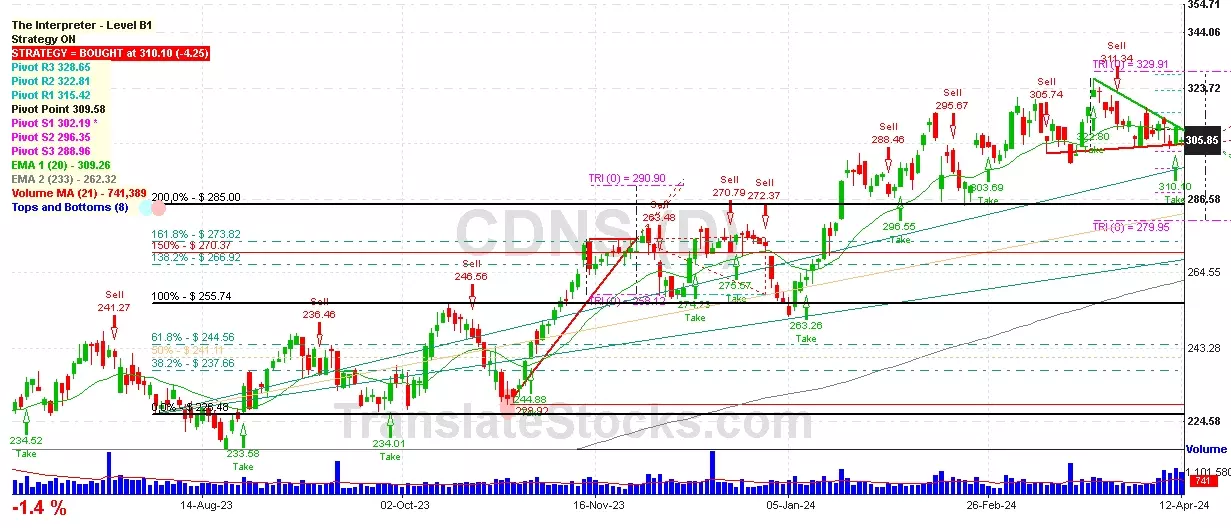
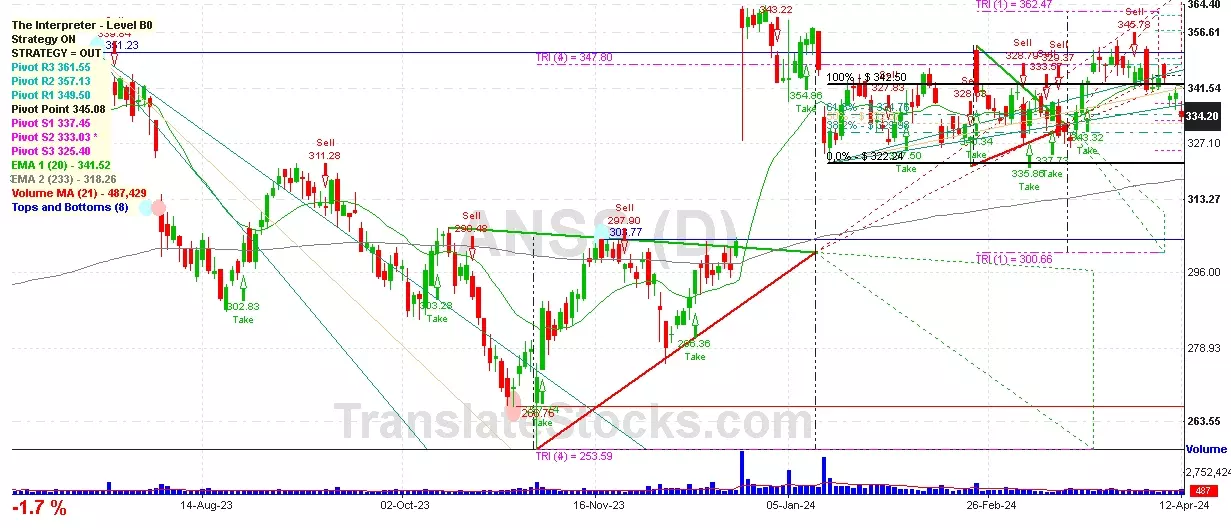
Hey Friend, I'm analysing ANSYS INC (ANSS), and it is between the Support of $ 333.03 (PivotS2) and the Resistance of $ 334.76 (61.8% of Fibonacci). The stock is also approaching the line of PivotS2 at $ 333.03, and if it goes below this line it could reach the next Support of 50% of Fibonacci at $ 332.37.

| Date | Price $ | Result % | Candle Name | Side |
|---|---|---|---|---|
| 001 04 Apr 2024 | Sell Price: 341.18 | Loss: Close Day2 ($ 344.10) | Engulfing | Sell |
| 002 12 Mar 2024 | Buy Price: 337.73 | Loss: Close Day2 ($ 330.29) | Engulfing | Buy |
| 003 08 Mar 2024 | Sell Price: 335.11 | Profit: Close Day1 ($ 333.57) | Engulfing | Sell |
| 004 05 Mar 2024 | Sell Price: 328.79 | Loss: Close Day2 ($ 339.37) | Abandoned Baby | Sell |
| 005 29 Feb 2024 | Buy Price: 334.17 | Profit: Close Day1 ($ 339.62) | Abandoned Baby | Buy |
| 006 22 Feb 2024 | Buy Price: 340.34 | Profit: Open Day1 ($ 340.65) | Abandoned Baby | Buy |
| 007 06 Feb 2024 | Sell Price: 336.66 | Loss: Close Day2 ($ 345.33) | Engulfing | Sell |
| 008 09 Nov 2023 | Sell Price: 284.42 | Loss: Close Day2 ($ 291.00) | Dark Cloud Cover | Sell |
| 009 03 Nov 2023 | Buy Price: 287.74 | Loss: Close Day2 ($ 281.80) | Abandoned Baby | Buy |
| 010 28 Sep 2023 | Buy Price: 297.86 | Profit: Open Day1 ($ 300.40) | Engulfing | Buy |
| 011 05 Sep 2023 | Sell Price: 317.46 | Loss: Close Day2 ($ 318.48) | Abandoned Baby | Sell |
| 012 18 Aug 2023 | Buy Price: 292.59 | Profit: Open Day1 ($ 294.11) | Piercing Line | Buy |
| 013 11 Aug 2023 | Buy Price: 301.21 | Profit: Close Day1 ($ 303.38) | Piercing Line | Buy |
| 014 16 Jun 2023 | Sell Price: 334.37 | Profit: Open Day1 ($ 329.86) | Dark Cloud Cover | Sell |
| 015 10 May 2023 | Buy Price: 295.81 | Profit: Close Day1 ($ 296.01) | Abandoned Baby | Buy |
| 016One Year Average | Both Sides Result for 15 Signals |
Loss: $ -24.91 ($ -1.66 / Signal) |
All of Them | Buy + Sell |
| Simple Moving Averages (SMA) Period | Value $ | Signal | Exponential Moving Averages (EMA) Period | Value $ | Signal | |
|---|---|---|---|---|---|---|
| 2 | 330.40 | BUY | 2 | 331.57 | BUY | |
| 3 | 329.79 | BUY | 3 | 330.36 | BUY | |
| 5 | 328.03 | BUY | 5 | 329.15 | BUY | |
| 8 | 326.55 | BUY | 8 | 329.08 | BUY | |
| 13 | 329.32 | BUY | 13 | 330.50 | BUY | |
| 21 | 335.24 | SELL | 21 | 332.67 | BUY | |
| 34 | 337.13 | SELL | 34 | 334.34 | SELL | |
| 55 | 336.49 | SELL | 55 | 334.13 | SELL | |
| 90 | 337.10 | SELL | 90 | 331.03 | BUY | |
| 200 | 318.24 | BUY | 200 | 320.95 | BUY |
Ansys Inc
IPO: 1996-06-20
Ticker: ANSSIndices: S&P 500,
Nasdaq 100,
Exchange: Nasdaq Nms - Global Market (US - USD)
Website: https://www.ansys.com/
Phone:
Common Stock
Technology (
Services-prepackaged Software
 Click to Enlarge