| Date | Price $ | Result % | Candle Name | Side |
|---|---|---|---|---|
| 001 10 Apr 2024 | Sell Price: 299.62 | Profit: Open Day1 ($ 299.47) | Abandoned Baby | Sell |
| 002 01 Apr 2024 | Buy Price: 302.26 | Profit: Close Day1 ($ 304.00) | Abandoned Baby | Buy |
| 003 22 Mar 2024 | Sell Price: 307.77 | Profit: Open Day1 ($ 303.70) | Engulfing | Sell |
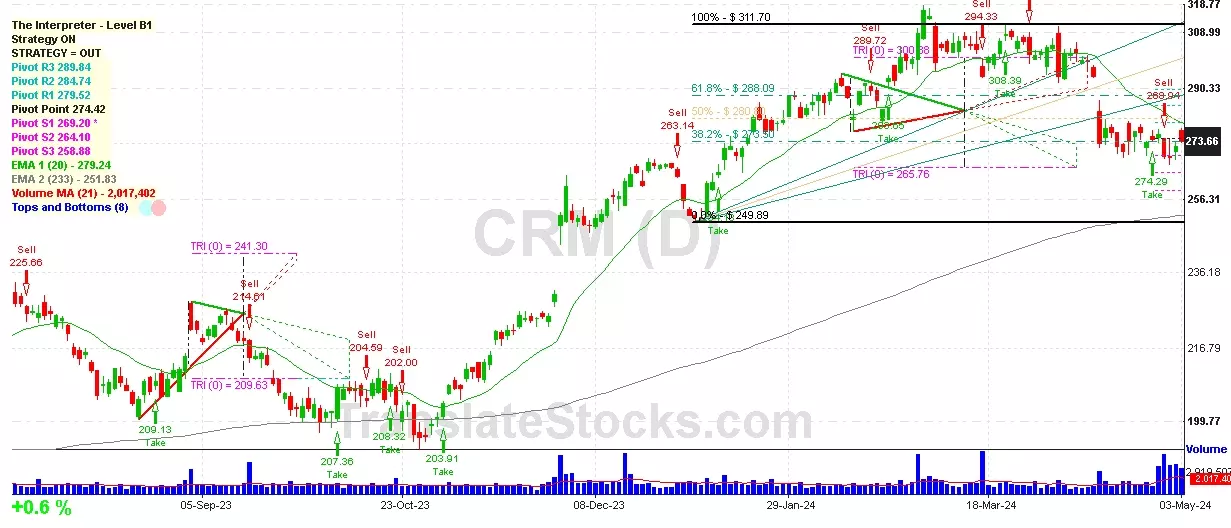
| 004 18 Mar 2024 | Buy Price: 300.51 | Profit: Close Day1 ($ 301.45) | Abandoned Baby | Buy |
| 005 23 Feb 2024 | Sell Price: 292.80 | Loss: Close Day2 ($ 299.50) | Dark Cloud Cover | Sell |
| 006 16 Feb 2024 | Sell Price: 289.72 | Profit: Open Day1 ($ 289.50) | Engulfing | Sell |
| 007 17 Jan 2024 | Buy Price: 271.44 | Profit: Open Day1 ($ 273.00) | Engulfing | Buy |
| 008 08 Jan 2024 | Buy Price: 260.87 | Profit: Close Day1 ($ 261.34) | Abandoned Baby | Buy |
| 009 18 Aug 2023 | Buy Price: 204.83 | Profit: Open Day1 ($ 206.00) | Piercing Line | Buy |
| 010 01 Jun 2023 | Sell Price: 212.90 | Profit: Open Day2 ($ 210.47) | Abandoned Baby | Sell |
| 011One Year Average | Both Sides Result for 10 Signals |
Profit: $ 6.05 ($ 0.60 / Signal) |
All of Them | Buy + Sell |
| Simple Moving Averages (SMA) Period | Value $ | Signal | Exponential Moving Averages (EMA) Period | Value $ | Signal | |
|---|---|---|---|---|---|---|
| 2 | 272.90 | BUY | 2 | 272.85 | BUY | |
| 3 | 271.49 | BUY | 3 | 272.45 | BUY | |
| 5 | 271.83 | BUY | 5 | 272.40 | BUY | |
| 8 | 272.85 | BUY | 8 | 273.17 | BUY | |
| 13 | 273.22 | BUY | 13 | 275.57 | SELL | |
| 21 | 281.01 | SELL | 21 | 279.70 | SELL | |
| 34 | 289.56 | SELL | 34 | 283.92 | SELL | |
| 55 | 293.61 | SELL | 55 | 284.89 | SELL | |
| 90 | 286.32 | SELL | 90 | 279.43 | SELL | |
| 200 | 249.60 | BUY | 200 | 256.83 | BUY |
Common Stock
Technology (
Services-prepackaged Software

 Click to Enlarge