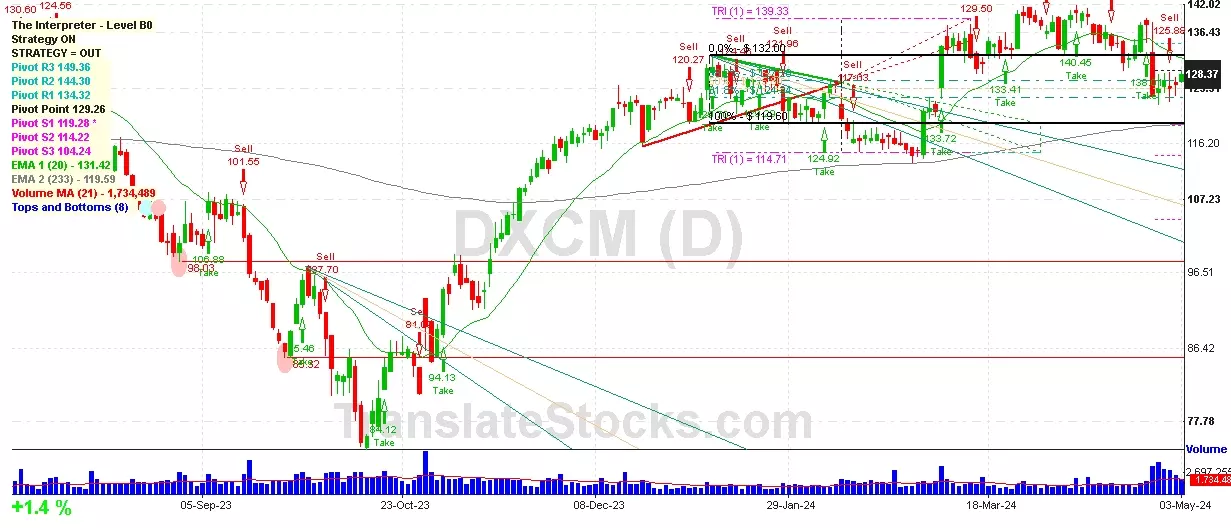
Hey Friend, I'm analysing DEXCOM INC (DXCM), and it is between the Support of $ 127.26 (38.2% of Fibonacci) and the Resistance of $ 129.26 (Pivot). The stock is also approaching the line of Pivot at $ 129.26, and if it goes above this line it could reach the next Resistance of 0% of Fibonacci at $ 132.00.

| Date | Price $ | Result % | Candle Name | Side |
|---|---|---|---|---|
| 001 26 Apr 2024 | Sell Price: 124.34 | Loss: Close Day2 ($ 127.39) | Abandoned Baby | Sell |
| 002 10 Apr 2024 | Sell Price: 140.32 | Profit: Open Day1 ($ 140.10) | Abandoned Baby | Sell |
| 003 13 Mar 2024 | Sell Price: 131.68 | Profit: Close Day1 ($ 129.50) | Engulfing | Sell |
| 004 05 Mar 2024 | Sell Price: 121.66 | Loss: Close Day2 ($ 133.24) | Engulfing | Sell |
| 005 05 Mar 2024 | Sell Price: 121.78 | Loss: Close Day2 ($ 133.24) | Dark Cloud Cover | Sell |
| 006 29 Dec 2023 | Sell Price: 124.09 | Profit: Open Day1 ($ 123.15) | Abandoned Baby | Sell |
| 007 18 Dec 2023 | Buy Price: 123.35 | Profit: Open Day1 ($ 123.63) | Engulfing | Buy |
| 008 31 Aug 2023 | Sell Price: 100.98 | Profit: Close Day2 ($ 100.33) | Engulfing | Sell |
| 009One Year Average | Both Sides Result for 8 Signals |
Loss: $ -21.82 ($ -2.73 / Signal) |
All of Them | Buy + Sell |
| Simple Moving Averages (SMA) Period | Value $ | Signal | Exponential Moving Averages (EMA) Period | Value $ | Signal | |
|---|---|---|---|---|---|---|
| 2 | 127.51 | BUY | 2 | 127.76 | BUY | |
| 3 | 126.97 | BUY | 3 | 127.56 | BUY | |
| 5 | 126.82 | BUY | 5 | 127.84 | BUY | |
| 8 | 129.29 | SELL | 8 | 128.77 | SELL | |
| 13 | 130.67 | SELL | 13 | 130.23 | SELL | |
| 21 | 133.58 | SELL | 21 | 131.51 | SELL | |
| 34 | 134.64 | SELL | 34 | 131.74 | SELL | |
| 55 | 130.35 | SELL | 55 | 130.31 | SELL | |
| 90 | 127.94 | BUY | 90 | 127.06 | BUY | |
| 200 | 114.86 | BUY | 200 | 123.28 | BUY |
Dexcom Inc
IPO: 2005-04-14
Ticker: DXCMIndices: S&P 500,
Nasdaq 100,
Exchange: Nasdaq Nms - Global Market (US - USD)
Website: https://www.dexcom.com/
Phone:
Common Stock
Life Sciences (
Surgical & Medical Instruments & Apparatus
 Click to Enlarge