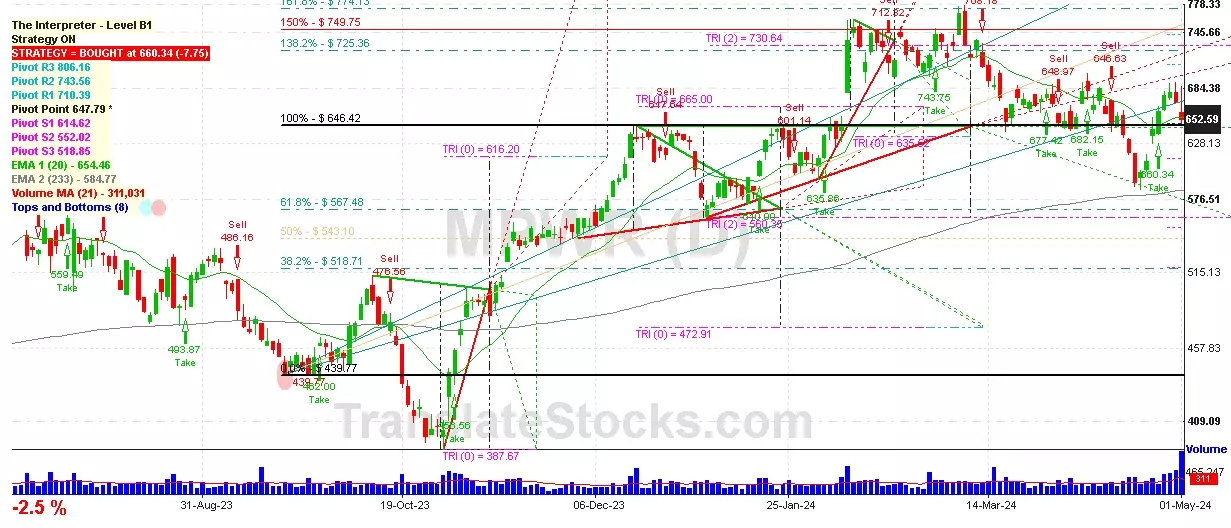
Hey Friend, I'm analysing MONOLITHIC POWER SYSTEMS INC (MPWR), and it is between the Support of $ 647.79 (Pivot) and the Resistance of $ 665.00 (Triangle Projection Level 0). The stock is also approaching the line of Pivot at $ 647.79, and if it goes below this line it could reach the next Support of 100% of Fibonacci at $ 646.42.

| Date | Price $ | Result % | Candle Name | Side |
|---|---|---|---|---|
| 001 10 Apr 2024 | Sell Price: 666.49 | Profit: Open Day2 ($ 665.88) | Abandoned Baby | Sell |
| 002 12 Feb 2024 | Sell Price: 729.87 | Profit: Open Day1 ($ 703.00) | Engulfing | Sell |
| 003 16 Jan 2024 | Buy Price: 596.41 | Profit: Open Day2 ($ 598.67) | Engulfing | Buy |
| 004 16 Nov 2023 | Sell Price: 536.98 | Loss: Close Day2 ($ 551.20) | Abandoned Baby | Sell |
| 005 28 Sep 2023 | Buy Price: 451.92 | Profit: Open Day1 ($ 460.05) | Engulfing | Buy |
| 006 14 Sep 2023 | Buy Price: 479.17 | Loss: Close Day2 ($ 463.19) | Abandoned Baby | Buy |
| 007 06 Jun 2023 | Buy Price: 497.41 | Profit: Open Day1 ($ 501.60) | Engulfing | Buy |
| 008One Year Average | Both Sides Result for 7 Signals |
Profit: $ 11.86 ($ 1.69 / Signal) |
All of Them | Buy + Sell |
| Simple Moving Averages (SMA) Period | Value $ | Signal | Exponential Moving Averages (EMA) Period | Value $ | Signal | |
|---|---|---|---|---|---|---|
| 2 | 660.96 | SELL | 2 | 658.90 | SELL | |
| 3 | 667.21 | SELL | 3 | 661.10 | SELL | |
| 5 | 667.84 | SELL | 5 | 659.51 | SELL | |
| 8 | 649.18 | BUY | 8 | 655.40 | SELL | |
| 13 | 641.93 | BUY | 13 | 652.87 | SELL | |
| 21 | 650.71 | BUY | 21 | 654.88 | SELL | |
| 34 | 658.47 | SELL | 34 | 659.83 | SELL | |
| 55 | 684.65 | SELL | 55 | 659.78 | SELL | |
| 90 | 660.90 | SELL | 90 | 646.11 | BUY | |
| 200 | 576.91 | BUY | 200 | 596.00 | BUY |
Monolithic Power Systems Inc
IPO: 2004-11-24
Ticker: MPWRIndices: S&P 500,
Exchange: Nasdaq Nms - Global Market (US - USD)
Website: http://www.monolithicpower.com/
Phone:
Common Stock
Manufacturing (
Semiconductors & Related Devices
 Click to Enlarge