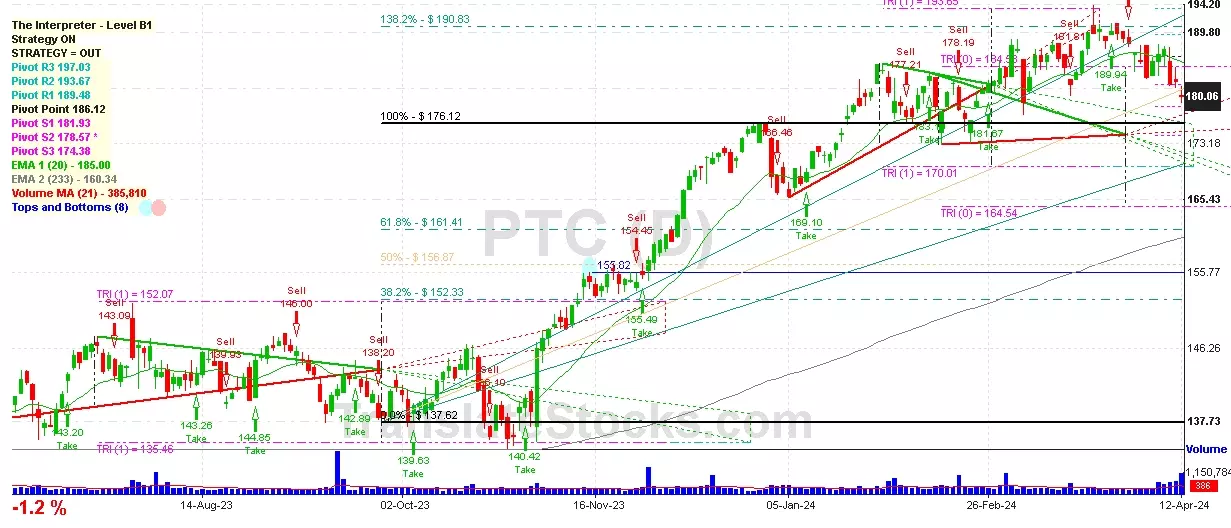
Hey Friend, I'm analysing PTC INC (PTC), and it is between the Support of $ 178.57 (PivotS2) and the Resistance of $ 181.93 (PivotS1). The stock is also approaching the line of PivotS2 at $ 178.57, and if it goes below this line it could reach the next Support of 100% of Fibonacci at $ 176.12.

| Date | Price $ | Result % | Candle Name | Side |
|---|---|---|---|---|
| 001 27 Mar 2024 | Sell Price: 189.60 | Profit: Close Day1 ($ 188.94) | Engulfing | Sell |
| 002 27 Mar 2024 | Sell Price: 189.71 | Profit: Close Day1 ($ 188.94) | Dark Cloud Cover | Sell |
| 003 26 Mar 2024 | Buy Price: 189.94 | Profit: Open Day1 ($ 191.25) | Abandoned Baby | Buy |
| 004 13 Mar 2024 | Sell Price: 185.75 | Profit: Close Day1 ($ 184.51) | Engulfing | Sell |
| 005 16 Jan 2024 | Sell Price: 171.59 | Profit: Open Day1 ($ 170.79) | Abandoned Baby | Sell |
| 006 18 Dec 2023 | Buy Price: 171.84 | Profit: Open Day1 ($ 172.57) | Abandoned Baby | Buy |
| 007 23 May 2023 | Sell Price: 130.86 | Profit: Open Day1 ($ 130.39) | Abandoned Baby | Sell |
| 008One Year Average | Both Sides Result for 7 Signals |
Profit: $ 5.98 ($ 0.85 / Signal) |
All of Them | Buy + Sell |
| Simple Moving Averages (SMA) Period | Value $ | Signal | Exponential Moving Averages (EMA) Period | Value $ | Signal | |
|---|---|---|---|---|---|---|
| 2 | 180.44 | BUY | 2 | 180.65 | BUY | |
| 3 | 180.46 | BUY | 3 | 180.41 | BUY | |
| 5 | 180.07 | BUY | 5 | 180.00 | BUY | |
| 8 | 178.74 | BUY | 8 | 179.87 | BUY | |
| 13 | 179.28 | BUY | 13 | 180.36 | BUY | |
| 21 | 181.97 | SELL | 21 | 181.30 | SELL | |
| 34 | 184.01 | SELL | 34 | 181.89 | SELL | |
| 55 | 183.13 | SELL | 55 | 180.95 | BUY | |
| 90 | 179.78 | BUY | 90 | 177.20 | BUY | |
| 200 | 161.58 | BUY | 200 | 164.81 | BUY |
Ptc Inc
IPO: 1989-12-08
Ticker: PTCIndices: S&P 500,
Exchange: Nasdaq Nms - Global Market (US - USD)
Website: https://www.ptc.com/
Phone:
Common Stock
Technology (
Services-prepackaged Software
 Click to Enlarge