| Date | Price $ | Result % | Candle Name | Side |
|---|---|---|---|---|
| 001 01 Apr 2024 | Sell Price: 198.28 | Profit: Open Day1 ($ 192.00) | Abandoned Baby | Sell |
| 002 19 Mar 2024 | Sell Price: 189.58 | Loss: Close Day2 ($ 193.53) | Abandoned Baby | Sell |
| 003 01 Mar 2024 | Buy Price: 184.75 | Loss: Close Day2 ($ 173.89) | Engulfing | Buy |
| 004 10 Jan 2024 | Sell Price: 202.00 | Profit: Close Day1 ($ 200.29) | Dark Cloud Cover | Sell |
| 005 04 Oct 2023 | Sell Price: 258.77 | Loss: Close Day2 ($ 270.28) | Engulfing | Sell |
| 006 19 Sep 2023 | Buy Price: 276.91 | Profit: Open Day1 ($ 278.15) | Engulfing | Buy |
| 007 19 Sep 2023 | Buy Price: 276.89 | Profit: Open Day1 ($ 278.15) | Piercing Line | Buy |
| 008 05 Sep 2023 | Sell Price: 294.12 | Profit: Open Day1 ($ 293.00) | Abandoned Baby | Sell |
| 009 30 May 2023 | Sell Price: 279.82 | Profit: Open Day1 ($ 277.59) | Engulfing | Sell |
| 010 23 May 2023 | Sell Price: 283.97 | Profit: Open Day1 ($ 281.35) | Abandoned Baby | Sell |
| 011One Year Average | Both Sides Result for 10 Signals |
Loss: $ -9.86 ($ -0.99 / Signal) |
All of Them | Buy + Sell |
| Simple Moving Averages (SMA) Period | Value $ | Signal | Exponential Moving Averages (EMA) Period | Value $ | Signal | |
|---|---|---|---|---|---|---|
| 2 | 169.01 | BUY | 2 | 172.04 | SELL | |
| 3 | 174.75 | SELL | 3 | 174.26 | SELL | |
| 5 | 181.08 | SELL | 5 | 177.76 | SELL | |
| 8 | 183.60 | SELL | 8 | 180.95 | SELL | |
| 13 | 184.51 | SELL | 13 | 184.13 | SELL | |
| 21 | 190.25 | SELL | 21 | 186.83 | SELL | |
| 34 | 191.89 | SELL | 34 | 188.67 | SELL | |
| 55 | 188.94 | SELL | 55 | 190.44 | SELL | |
| 90 | 192.00 | SELL | 90 | 195.47 | SELL | |
| 200 | 224.43 | SELL | 200 | 219.53 | SELL |
Paycom Software Inc
IPO: 2014-04-15
Ticker: PAYCIndices: S&P 500,
Exchange: New York Stock Exchange, Inc. (US - USD)
Website: http://www.paycom.com/
Phone:
Common Stock
Technology (
Services-prepackaged Software

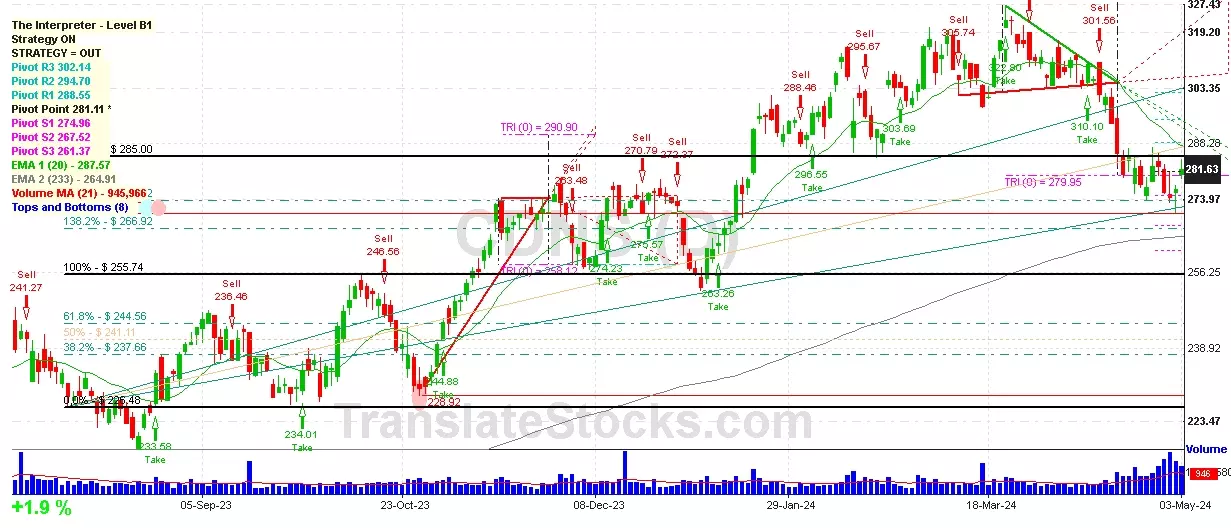
 Click to Enlarge
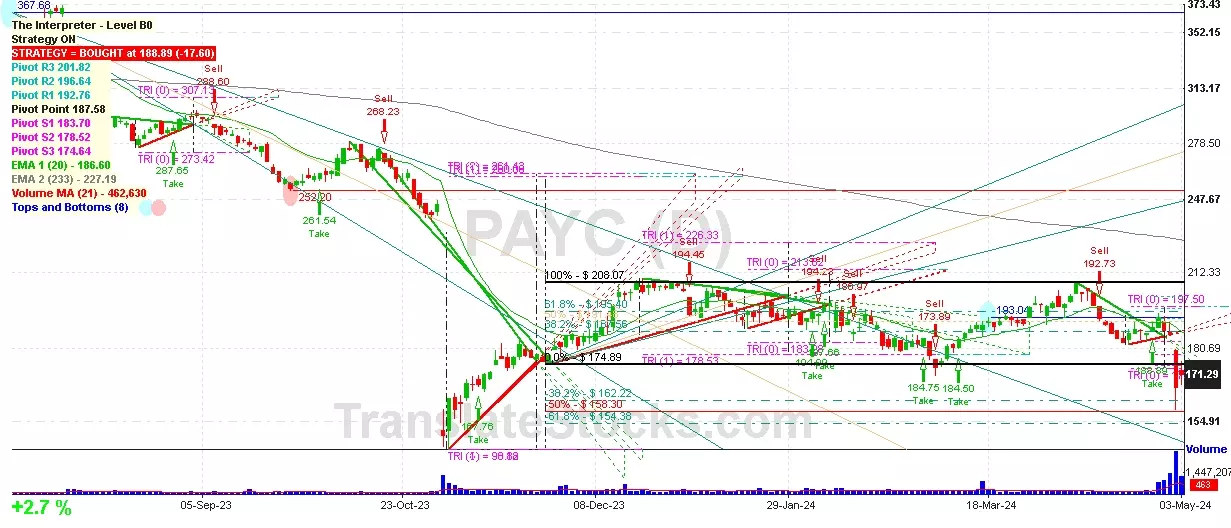